the Creative Commons Attribution 4.0 License.
the Creative Commons Attribution 4.0 License.
 | 18 Jul 2022
Factors controlling atmospheric DMS and its oxidation products (MSA and nssSO42−) in the aerosol at Terra Nova Bay, Antarctica
Elena Barbaro
Simone Bonamano
Laura Caiazzo
Alcide di Sarra
Matteo Feltracco
Paolo Grigioni
Jost Heintzenberg
Luigi Lazzara
Michel Legrand
Alice Madonia
Marco Marcelli
Chiara Melillo
Daniela Meloni
Caterina Nuccio
Giandomenico Pace
Ki-Tae Park
Suzanne Preunkert
Mirko Severi
Marco Vecchiato
Roberta Zangrando
Rita Traversi
This paper presents the results of simultaneous high time-resolution measurements of biogenic aerosol (methane sulfonic acid (MSA), non-sea salt sulfate nssSO2-4) with its gaseous precursor dimethylsulfide (DMS), performed at the Italian coastal base Mario Zucchelli Station (MZS) in Terra Nova Bay (MZS) during two summer campaigns (2018–2019 and 2019–2020). Data on atmospheric DMS concentration are scarce, especially in Antarctica. The DMS maximum at MZS occurs in December, one month earlier than at other Antarctic stations. The maximum of DMS concentration is connected with the phytoplanktonic senescent phase following the bloom of Phaeocystis antarctica that occurs in the polynya when sea ice opens up. The second plankton bloom occurs in January and, despite the high dimethylsufoniopropionate (DMSP) concentration in seawater, atmospheric DMS remains low, probably due to its fast biological turnover in seawater in this period. The intensity and timing of the DMS evolution during the two years suggest that only the portion of the polynya close to the sampling site produces a discernible effect on the measured DMS. The closeness to the DMS source area and the occurrence of air masses containing DMS and freshly formed oxidation products allow us to study the kinetic of biogenic aerosol formation and the reliable derivation of the branch ratio between MSA and nssSO2-4 from DMS oxidation that is estimated to be 0.84±0.06. Conversely, for aged air masses with low DMS content, an enrichment of nssSO2-4 with respect to MSA, is observed. We estimate that the mean contribution of freshly formed biogenic aerosol to PM10 is 17 % with a maximum of 56 %. The high contribution of biogenic aerosol to the total PM10 mass in summer in this area highlights the dominant role of the polynya on biogenic aerosol formation. Finally, due to the regional and year-to-year variability of DMS and related biogenic aerosol formation, we stress the need for long-term measurements of seawater and atmospheric DMS and biogenic aerosol along the Antarctic coast and in the Southern Ocean.
- Article
(2570 KB) - Full-text XML
- BibTeX
- EndNote


Dimethylsulfide (DMS) is a volatile organic sulfur compound produced in surface oceanic waters all over the world, characterized by low solubility in water. DMS is formed by the breakdown of the dimethylsulfoniopropionate (DMSP), a phytoplankton metabolite (Stefels, 2000). In surface waters, substantial quantities of dissolved DMSP and DMS can be detected, but another important sulfur cycle compound in seawater is dimethyl sulfoxide (DMSO) whose concentrations exceed the concentration of DMS and DMSP (Asher et al., 2017). DMSO is mainly produced from photochemical and bacterial DMS oxidation, the latter process may serve as an energy source for bacteria (Boden et al., 2011). The loss processes of dissolved DMS include (i) microbial consumption, (ii) photooxidation, (iii) air–sea gas exchange and (iv) vertical export by mixing (Simó, 2004). In particular, approximately 10 % of total global DMS production ventilates through the sea–air interface (Simó et al., 1999; Simó and Pedrós-Alió, 1999) to the atmosphere, where it accounts for approximately 50 % of the natural global sulfate burden (Simó, 2001). The global DMS flux to the atmosphere is currently estimated to be 28.1 (17.6–34.4) Tg S per year, which is approximately half the anthropogenic global atmospheric sulfur input (Klimont et al., 2013; Hulswar et al., 2021). This makes DMS an important contributor to global sulfur fluxes. Once in the atmosphere, DMS is oxidized both in the gas and water phase by O3 or by the hydroxyl (OH), nitrate (NO3), chlorine (Cl) and bromine oxide (BrO) radicals to form either methanesulfonic acid (MSA) or sulfur dioxide (SO2), which is further oxidized to H2SO4 (Gondwe et al., 2003; Read et al., 2008; Fung et al., 2022). The production of sulfuric acid and MSA (having low vapor pressure) may lead to new particle formation (NPF) when few particles' condensation nuclei are available (Dall'Osto et al., 2017). NPF linked to DMS products may play a fundamental role in the polar regions, with possible effects on climate (Dall'Osto et al., 2017). The growth of particles following NPF is crucial in generating cloud condensation nuclei (CCN), which eventually allow the formation of cloud drops. As CCN are important for cloud formation and thereby indirectly affect the radiation balance, they have an important climatic impact and are involved in feedback processes (Charlson et al., 1987). Actually, there are still large uncertainties in both the sign and the amplitude of this feedback (Quinn and Bates, 2011). Besides, model calculations of the future response of DMS to changes in global temperature vary widely: both increases (Cameron-Smith et al., 2011; Gabric et al., 2005; Qu et al., 2021; Wingenter et al., 2007), and decreases (Kloster, 2007) in surface water DMS concentrations have been predicted.
DMS concentrations in global climatology show that the polar regions are of significant importance to the total global DMS production, in particular, the Southern Ocean (Gondwe et al., 2003; Hulswar et al., 2021). The total annual Southern Ocean (south of 40∘ S) DMS flux is estimated at approximately 5.8 Tg S (Hulswar et al., 2021). Most of the DMS emission, 3.4 Tg S (Jarníková et al., 2016), occurs during summer months (December to February).
The link between climate change and DMS production is complex and involves a great number of oceanic and atmospheric processes: in polar regions, the maximum DMS concentrations in the water occurs in early summer and is primarily associated with sea-ice break-up (Stefels et al., 2018). Although the retreat in sea ice will directly impact on the release of DMSP and DMSP-producing algae, changes in the physical environment can also indirectly impact on phytoplankton productivity and composition through changes in light and nutrient availability (Ducklow et al., 2007; Montes-Hugo et al., 2009).
Wind speed plays a relevant role in DMS production in the ocean and in regulating the flux from the ocean. The depth of the oceanic mixed layer, largely influenced by wind, is crucial for the determination of oceanic DMS distribution: for example, a high wintertime ice extent can shield the water column from high wind speeds, thus, preventing the deepening of the winter mixed layer. Declining wind speeds in summer can cause the persistence of a shallower mixed-layer depths, and when these variables coincide with the seasonal summertime increase in light availability for primary production, high DMS summer maxima are observed (Saba et al., 2014). Similarly, high summertime winds or a shorter duration of the sea ice season along the marginal ice zone can lead to lower summertime chlorophyll-a (Chl-a) maximum as the mixed layer is deeper, thereby, inhibiting algal cells from overcoming light limitation.
Besides processes in the water column, ocean-air DMS flux has a more of a linear relationship with wind speed, as it is largely transported by interfacial exchange and it is not as influenced by bubbles (i.e., whitecaps, Bell et al., 2017; Zavarsky et al., 2018) as other more insoluble gases. Vlahos and Monahan (2009) evidenced that at a wind speed higher than 10 m s−1, DMS transfer rates decrease due to the amphiphilic nature of DMS that leads to transfer delay. This is because higher wind speeds cause a higher concentration of sinking bubbles by whitecapping of the ocean surface. Anyway, Marandino et al. (2007) demonstrate that most of the variance in the fluxes can be accounted for by variations in DMS sea surface concentration (37 %) than wind speed (19 %).
Several studies tried to correlate DMS concentrations in sea water and algal biomass from surface and satellite data, but contradictory results have been found: positive (Andreae and Barnard, 1984; Belviso et al., 2004; Leck et al., 1990), negative (Froelich et al., 1985; Watanabe et al., 1995) as well as absent (Barnard et al., 1984; Deng et al., 2021) correlations were found. Such uncertain relationships affect the calculation of DMS flux based on the algal biomass. In most models, the DMS fluxes are obtained from small or medium-scale field observations (Gabric et al., 2014; Kloster et al., 2006), making our understanding of the mechanisms controlling DMS emissions regionally dependent; however, some regions of the Southern Ocean are not covered by measurements, making these estimates unpractical.
Specifically, data on DMS concentrations in the Ross Sea are scarce and atmospheric DMS observations are missing. Actually, the study of DMS production and its fate in the atmosphere is relevant in this area due to the presence of a persistent polynya. Polynyas are areas of seasonally open water surrounded by sea ice in high latitude regions. They are characterized by an abundance of macronutrients, an ample supply of iron (Fe) from melting sea ice and/or glaciers and continental shelf sediments resulting from the intrusion of relatively warm, salty and nutrient-rich Circumpolar Deep Water (Arrigo et al., 2012; Sherrell et al., 2015; St-Laurent et al., 2017). Consequently, they often exhibit high primary productivity (Arrigo et al., 2012; Arrigo and van Dijken, 2003; Yager et al., 2012) because they are the first polar marine systems to be exposed to the increasing springtime solar radiation (Arrigo and van Dijken, 2003; Criscitiello et al., 2013). The polynyas in the Southern Ocean are the most productive biological regions and have the highest DMS sea–air flux in the world (Hulswar et al., 2021). DMS concentrations as high as several hundred nanomoles per liter have been observed in polynyas along the coastal regions of Antarctica, such as the Ross Sea and Amundsen Sea (Tortell et al., 2012; del Valle et al., 2009), where there are favorable conditions for Phaeocystis antarctica blooms (Oliver et al., 2020).
Finally, the large uncertainty in the processes surrounding DMS production emphasizes the need for an improved mechanistic understanding and model parameterization of the atmospheric DMS. However, measurements of DMS in the atmosphere are scarce and especially in coastal Antarctica because of the difficulty in conducting a field observation in these extreme environments. Therefore, the sources and the evolution of the aerosol over the Antarctic are still a subject of many open questions. It is necessary to fill the data gap in the knowledge of biogenically derived aerosols (both secondary inorganic and primary organics) in the Antarctic to improve understanding of the effects of ocean ecosystems on the marine aerosol–cloud–climate system.
In this study, we report high-resolution (12 h) measurements of MSA and nssSO2-4 in the particle-phase simultaneous to gas-phase DMS obtained for the first time in northern Victoria Land, at the Mario Zucchelli Station (MZS) facing the polynya area in the Ross Sea.
This work gives new hints to enhance our knowledge of the interactions between oceanographic parameters, the surface ocean biosphere and biogenic aerosol formation in this region of our planet.
2.1 Sampling area
Aerosol and DMS sampling are performed in two Antarctic summer campaigns (AC): 2018–2019 and 2019–2020. The campaigns lasted from the beginning of November until the end of January in the area surrounding the Antarctic Italian base, Mario Zucchelli Station (MZS – 74∘42′ S, 164∘07′ E), located at Terra Nova Bay, along the coast of the Northern Foothills to north-east of Gerlache Inlet (Fig. 1). There is a persistent polynya in the sea facing the base, the extent of which is shown in the average ice maps for the two campaigns (Fig. 1). Figure 1 also includes average DMS concentrations (nM) in surface waters for the period December–January, according to the climatology of Hulswar et al. (2021).

Figure 1Average sea ice cover during campaign 2018–2019 (a) and 2019–2020 (b) with sea ice data from NSIDC (https://nsidc.org, last access: 4 November 2021) and (c) average DMS (nM) in surface waters during December–January according to the DMS climatology of Hulswar et al. (2021). Figure on the bottom (d) reports the enlarged map of the Terra Nova Bay with Mario Zucchelli Station (MZS – red star) and the aerosol sampling site (Campo Icaro – light blue star). The geographical location of the volcano Erebus (Er.V) and the Antarctic stations reported in Table 1 are reported in (a), (b) and (c).
2.2 Aerosol sampling and analysis
In order to avoid possible contamination from the base, the site chosen for aerosol sampling is Icaro Camp (74∘42′43′′ S, 164∘07′00′′ E) located about 2 km south of MZS. The aerosol sampler was installed on the hill facing the sea at about 30 m above sea level.
Aerosol sampling was performed at 12 h resolution by a low volume sequential aerosol sampler (Giano – Dado lab Srl Milano) equipped with PM10 sampling head operating at a constant air flow of 2.3 m3 h−1, in accord with the European rule EN12341. Aerosol samples were collected on Teflon filters (PALL, Germany), 47 mm in diameter, with 2.0 µm nominal porosity and 99.5 % sampling efficiency for 0.3 µm aerodynamic particle diameter. The filters were shipped to Italy, being kept at −20 ∘C and stored in Petri plastic dishes until they were cut, extracted and analyzed.
In the laboratory, the PM10 mass was determined by weighting filters before and after the sampling on a five-digit microanalytical balance (Sartorius) equipped with an ionic cannon to avoid mass fluctuations due to the electrostatic charge of filters. Before weighting, filters were stored in a dryer for 48 h with 50±5 % relative humidity. A fourth of each filter was devoted to the ion determination by ion chromatography (IC). The 1/4 filter was extracted in ultrapure water (resistivity > 18 MΩ) in an ultrasonic bath at room temperature, then the ionic content was determined by three ion chromatographs (two ICS-1000 and one DX500 Thermo Fisher Scientific Inc., USA) equipped with Gilson 222 XL autosampler. This system makes it possible to simultaneously determine both anions (inorganic and selected low molecular weight organic anions) and cations within 10 min. Details on IC measurements are reported in Becagli et al. (2022).
In order to exclude the sea salt contribution to the total SO2-4 budget, the non-sea salt (nss) SO2-4 was calculated as follows:
where SO2-4 and Na+ are the measured concentrations in the aerosol samples (as ng m−3) and (SO2-4/Na+)sw is the SO2-4 to Na+ ratio in sea water 0.25 w/w (Henderson and Henderson, 2009).
2.3 Gaseous DMS sampling and analysis
DMS sampling is performed near the main MZS building at about 5 m distance from the sea at 2 m above sea level. The sampling was done at sub daily resolution (typically four samples in 24 h) by filling electropolished stainless steel canisters by compressing the air at 4 bars within several minutes with a membrane pump (Millipore XX5522050). Before sampling, the canister was filled and emptied two times with ambient air in order to wash the canister, avoiding memory effects from the previous samples.
DMS measurements were made in the MZS laboratories by using a gas chromatograph equipped with a flame photometric detector (HP6890, 393 nm). DMS is trapped in an ethanol bath at −70 ∘C on a porous polymer resin based on 2.6-diphenilene oxide (Tenax®) contained in a sample loop. DMS is injected in the GC by thermal desorption in boiling water. Working conditions are reported in detail by Legrand et al. (2001). Daily calibrations were achieved by using a permeation tube (VICI Metronics, Santa Clara California) thermostated at 30 ∘C. The permeation tube was calibrated and its stability was checked, resulting in less than 5 % changes within one year (Preunkert et al., 2007). The limit of quantification (LOQ) is 0.2 ng, leading to an atmospheric detection limit of 12 pptV for the 6 L volume of air usually trapped into the Tenax®. In order to reduce the LOQ, a high amount of air (up to 25 L) is trapped into the Tenax® at the beginning of the field campaign when DMS concentration was low.
2.4 DMSP in sea water sampling and analysis
During both ACs, sea water samples were collected at the sea surface in two sites about once a week when the piers were free from sea ice and the meteorological condition allowed the use of a boat. The two sampling sites were chosen in ice-free water about 2 miles from the coast and from the sea ice margin and 2 miles from each other. Few samples in November 2018 were collected in a hole in the pack ice, about 1 km from MZS in the Gerlache Inlet. The samples were collected in Schott® bottles, acidified to pH < 2 by adding a small amount of distilled HNO3, then hermetically sealed and maintained at 4 ∘C until the analysis. The analysis was accomplished at the Korea Polar Research Institute (KOPRI) laboratories. The preserved DMSP sample was hydrolyzed to gaseous DMS using 10 M NaOH (addition of 0.25 mL per mL sample) and was allowed to react overnight in the dark. Then, DMS was measured by using a gas chromatography equipped with a pulsed flame photometric detector (GC-PFPD) as described in Park et al. (2014). The DMSP sample was measured in duplicate and the analytical precision was generally better than 5 %.
2.5 UV-A and SW irradiance measurements
Measurements of downwelling photosynthetically active radiation and shortwave irradiance were made at Icaro Camp throughout 2018–2019 and 2019–2020. Measurements of UV-A and UV-B irradiances were added during the 2019–2020. The shortwave irradiance was measured with a compact Kipp and Zonen SP Lite sensor, while the photosynthetically active radiation (PAR) with a LI-COR 190R. Both instruments were calibrated by the manufacturer before deployment. In addition, the radiometers were installed at the Lampedusa Climate Observatory before deployments in Antarctica in 2018 and 2019, where they were compared with instruments continuously running at the site. The calibration of the shortwave irradiance radiometers at Lampedusa is traceable to the World Meteorological Organization World Radiation Reference scale (e.g., di Sarra et al., 2019). The PAR calibration scale has been maintained at Lampedusa, relying on the initial manufacturer calibration and on the local calibration of a multi-band radiometer through the Langley plot method (Trisolino et al., 2017).
A UV-A and a UV-B broadband radiometer, a Delta-T UV2/ap and UV2/bp, respectively, were added for the 2019–2020 AC. The radiometers were calibrated at Lampedusa before the campaign by comparison with measurements of spectral irradiance performed with a double monochromator Brewer spectrometer. Nominal spectral response functions (peaked respectively at 373 ad 313 nm for the UV-A and UV-B, corresponding bandwidths of about 31 and 26 nm) were used in the determination of the broadband calibration. The Brewer spectrophotometer is regularly calibrated on site with 1000 W FEL lamps (di Sarra et al., 2008).
2.6 Wind speed and direction data
Wind speed and direction data were measured at Eneide automatic weather station (AWS) (74∘41′45′′ S, 164∘5′32′′ E) that takes part of the Meteo-Climatological Observatory at MZS and Victoria Land maintained by the Italian National Programme of Antarctic Research (http://www.climantartide.it, last access: 15 September 2021). This AWS is nearest to both the DMS and aerosol sampling sites and it has been used in this work.
2.7 Satellite data of sea ice and chlorophyll
Daily maps of Southern Hemisphere sea ice cover were obtained from the National Snow & Ice Data Center. Information on sea ice extent is derived from the analysis of satellite passive microwave brightness temperature data from the Nimbus-7 Scanning Multichannel Microwave Radiometer (SMMR) and from a series of Special Sensor Microwave Imager (SSM/I) and Special Sensor Microwave Imager/Sounder (SSMIS) instruments (Fetterer et al., 2017). The nominal spatial resolution is 25×25 km2. Data were downloaded from https://nsidc.org/data (last access: 22 December 2021).
Satellite-derived daily L3 datasets of surface chlorophyll-a concentration with a 4 km spatial resolution from the European Space Agency's GlobColour Project (http://hermes.acri.fr, last access: 15 September 2021) were obtained from the Copernicus Marine Environment Monitoring Service (CMEMS, https://marine.copernicus.eu/, last access: 15 September 2021). The Chl-a product is derived by reprocessing the merged observations from five satellite radiometers (MODIS on Aqua, VIIRS from Suomi-NPP and JPSS-1, and OLCI from Sentinel 3a and 3b). The GlobColour dataset is a common and appropriate choice for phytoplankton dynamics studies, even in the Southern Ocean (Ardyna et al., 2017; Cole et al., 2015).
2.8 Backward trajectories calculation
Table 1Mean and standard deviation of DMS, MSA and nssSO2-4 concentrations in coastal Antarctic sites.
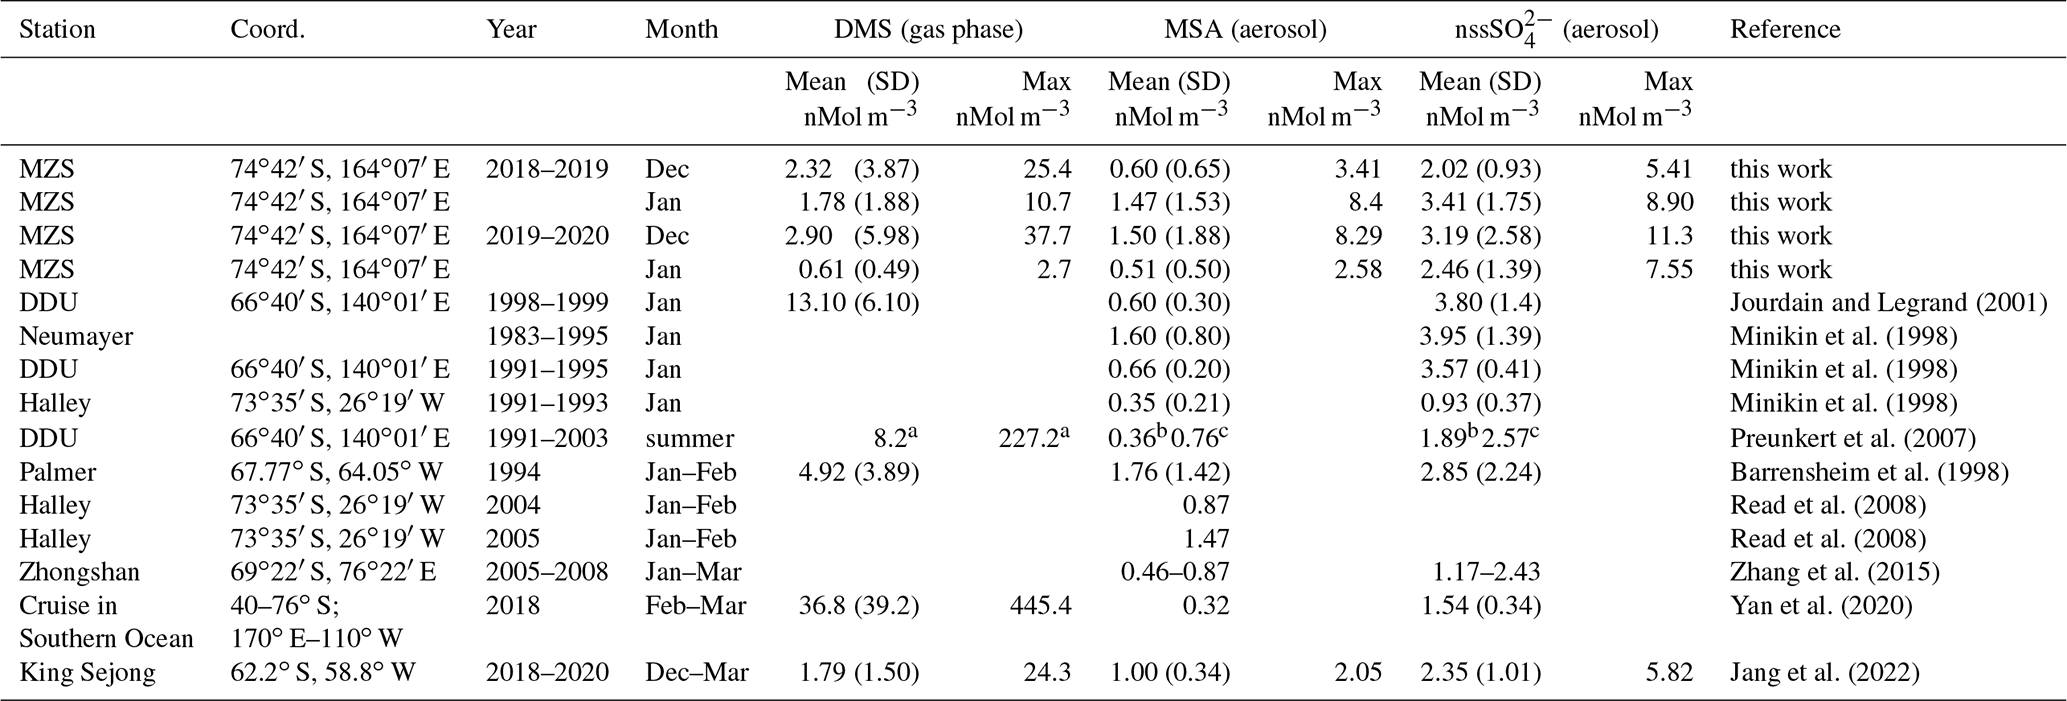
a summer mean calculated over the years 1999–2003; b summer mean calculated over the years 1997/98, 2001/02, 2002/03; c summer mean calculated over the years 1996/97, 1999/00, 2001/02.
Ten-day back trajectories are calculated with the HYSPLIT-model (Stein et al., 2015). We used the ensemble method of the model that has been incorporated directly into the code, so that trajectories are automatically computed about a three-dimensional cube, about the starting point at 300 m above MZS. The initial positions are not offset, just the meteorological data point associated with each particular trajectory, so that all trajectories start from the same point (https://www.ready.noaa.gov/documents/Tutorial/html/traj_ensem.html, last access: 22 December 2021). The trajectories are based on the meteorological fields of the Global Data Assimilation System (GDAS1) provided by the US National Weather Service's National Centers for Environmental Prediction (NCEP) at 1 degree resolution (https://www.ready.noaa.gov/gdas1.php, last access: 22 December 2021).
Figure 2 shows the time series of DMS, MSA and nssSO2-4 concentrations during the two summer Antarctic campaigns. In order to derive the stoichiometric ratio between the two aerosol species (MSA and nssSO2-4) and its gaseous precursor (DMS), the concentrations are reported in nMol m−3.
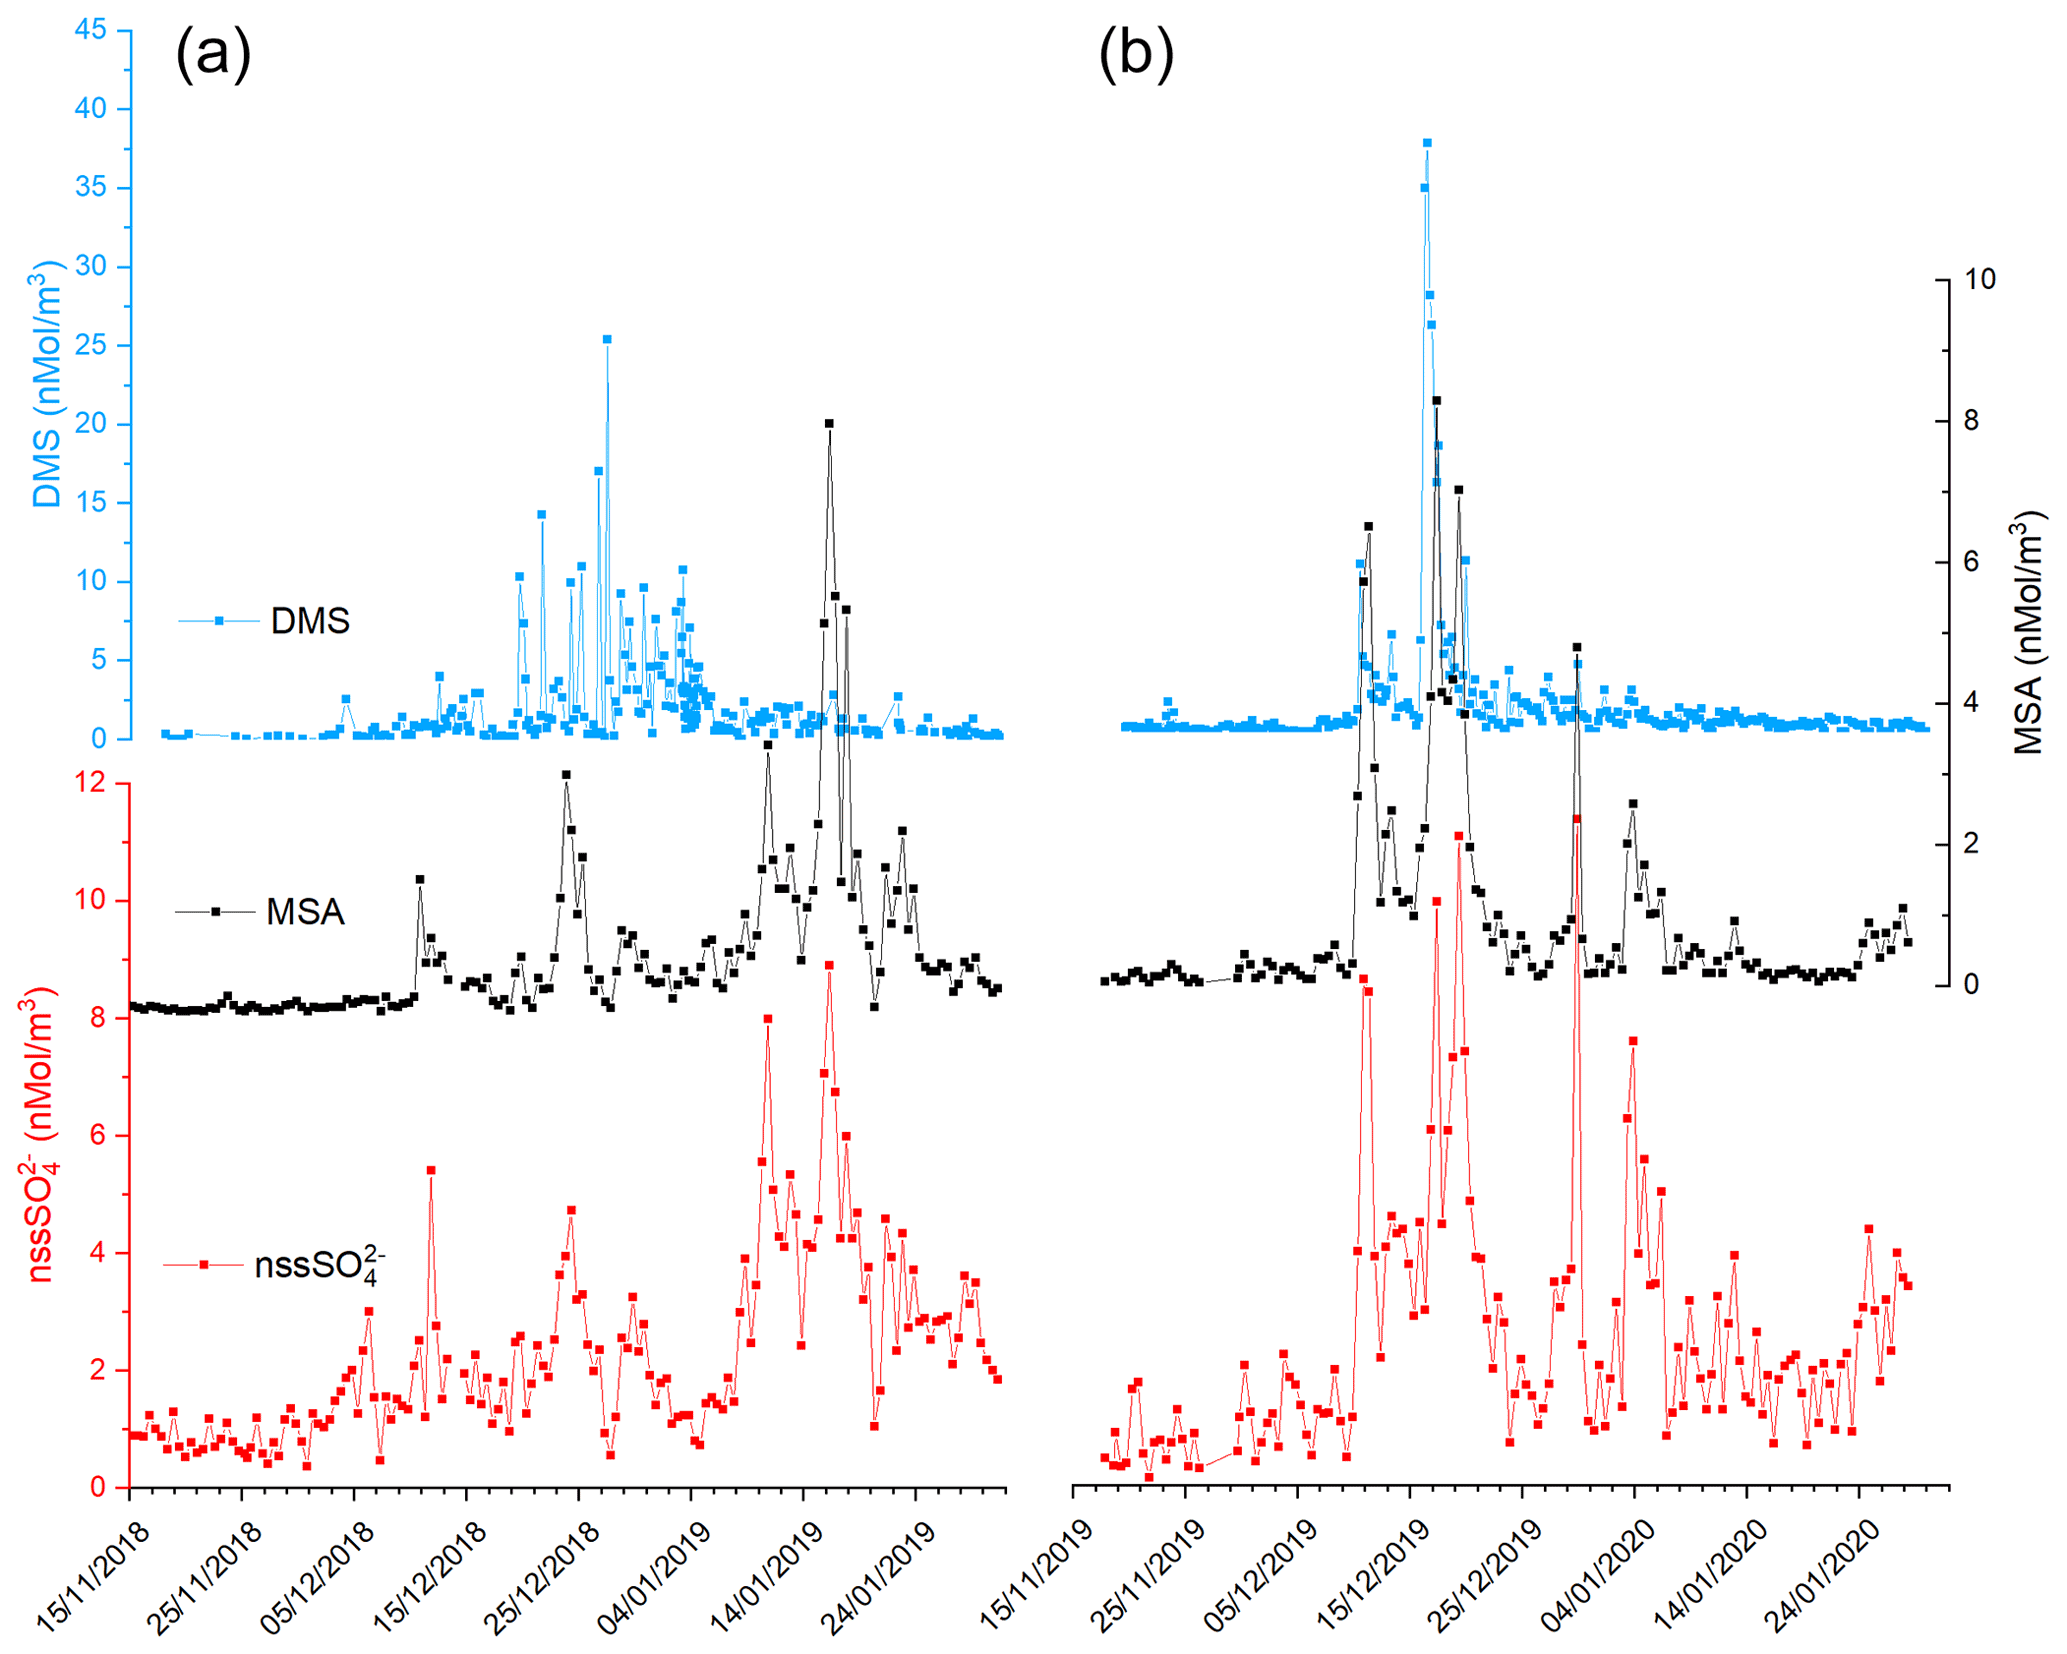
Figure 2Time series of DMS, MSA and nssSO2-4 in the two AC: 2018–2019 (plots in a) and 2019–2020 (plot in b).
The three compounds display very different patterns in the two summer ACs, as concerns timing and concentration maxima. During the 2018–2019 AC, the DMS concentration maxima are lower but last longer than in the 2019–2020 campaign. The median and 75th percentile of the DMS concentration measured in the two ACs are 0.67 and 1.81 nMol m−3, respectively. DMS values higher than the 75th percentile occurred during 27 % and 17 % of the time for the 2018–2019 AC and 2019–2020 AC, respectively, although the maximum DMS concentration was lower (25.4 nMol m−3) in the 2018–2019 AC than in the 2019–2020 AC (37.7 nMol m−3). Basic statistics on the measured values of DMS, MSA and nssSO2-4 in the two ACs are reported in Table 1 and are compared with measurements performed at other Antarctic sites and over the Southern Ocean. Biogenic aerosol data from Antarctic sites and the Southern Ocean are scarce and even more so for measurements of DMS. However, despite a general spatial (site-to-site) and temporal (year-to-year at the same site) variability, some considerations can be made. Despite its more southern position, the maximum DMS concentration at MZS occurs earlier (December) than at Dumont D'Urville (DDU) and over the Southern Ocean (January). This is likely due to the influence of the polynya, where an early phytoplanktonic bloom and, consequently, an early release of DMS to the atmosphere from the ice-free area takes place. However, notwithstanding the large year-to-year variability, the DMS summer mean and maximum concentration at MZS are lower than at the other sites reported in Table 1. Maximum concentrations of MSA and nssSO2-4 at MZS occur in December (in correspondence with the DMS maxima) or in January. The MSA and nssSO2-4 peaks coincide largely with those of its precursor DMS. However, the DMS number of moles is always larger than that of MSA and nssSO2-4. The DMS lifetime in summer in Antarctica is modeled to be in the range 0.5–3 d (Faloona, 2009; Hezel et al., 2011; Fung et al., 2022). Consequently, we assume that the measured DMS comes from the open ocean areas near the sampling site and is not yet fully oxidized.
Although MSA concentrations show a high site-to-site variability, it appears that at MZS, MSA concentrations are higher than at the other sites reported in Table 1. Non-sea salt SO2-4 values at MZS are of the same order of magnitude as at the other Antarctic sites, except at Halley and on the ocean cruise where smaller concentrations are found.
3.1 Factors controlling atmospheric DMS: wind speed and direction, Chl and sea ice extent
The difference between the DMS evolution in ACs 2018–2019 and 2019–2020 shown in Fig. 2 may be due to different causes: biological (DMS production from phytoplankton), physical (DMS flux from sea water to the atmosphere) or chemical (different rates of DMS oxidation in the atmosphere).
The role of wind speed has been firstly investigated. The DMS sea air flux depends on oceanic DMS concentrations and on the transfer velocity coefficient (kw), which is a function of wind speed (Nightingale et al., 2000; Vlahos and Monahan, 2009; Bell et al., 2017; Zavarsky et al., 2018). Moreover, the measured DMS atmospheric concentrations at coastal sites are expected to be heavily influenced by the wind direction as DMS sea-to-air transfer occurs only at the ice-free ocean surface and air masses coming from the ice sheet do not contain DMS.
In the AWS hourly dataset, wind coming from the continental ice sheet, i.e., wind direction between 200 and 350∘, were identified in the period 6 December–6 January when maximum DMS release in the atmosphere is measured in both campaigns. Surprisingly, the fraction of time with winds blowing from the ice sheet is higher in 6 December 2018–6 January 2019 (when more samplings with the DMS concentration >75th percentile are observed) than 6 December 2019–6 January 2020 (68 % and 48 % of time, respectively, see Table 2), suggesting that the different evolution of the DMS concentration is not produced by a different pattern of wind direction.
Data display, conversely, a dependency on wind speed. The distribution of wind speeds for cases with high DMS concentrations (>75th percentile) displays that the 82 %–83 % of wind speeds are in the range 1–10 m s−1 in the two campaigns.
Table 2Number of data and percentage of DMS concentrations higher than the 75th percentile, wind direction from the ice sheet and wind speed lower than 10 m s−1.
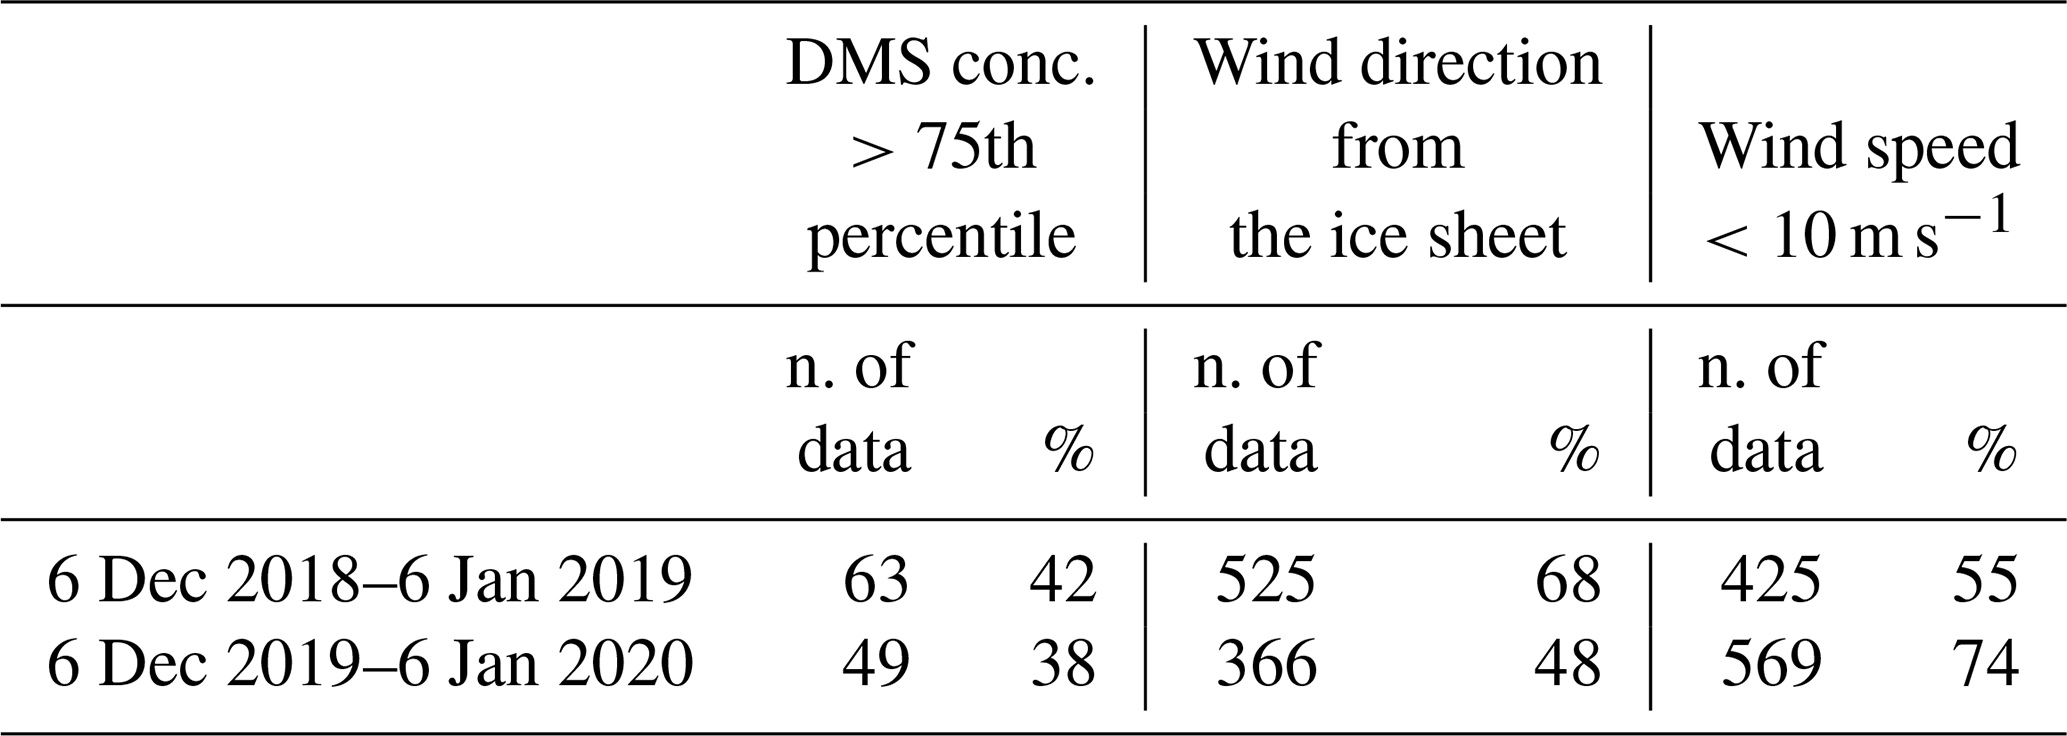
This is consistent with a modelized DMS transfer rate as function of wind speed that increases as wind speed increases up to 10 m s−1, but decreases as wind speed increases (Vlahos and Monahan, 2009).
If we consider the wind speed velocity in the range 1–10 m s−1 as the best conditions for DMS transfer rate by looking at the wind distribution in the abovementioned time period for the two years, we can see an opposite pattern than expected with a lower percentage of favorable wind speed in the year with the higher number of DMS concentration higher than the 75th percentile (Table 2).
Therefore, large differences in the DMS sea-to-air transfer velocity do not seem to occur and are not expected to be the cause of the different behavior of DMS evolution in the two ACs. Unfortunately, we do not have measurements of DMS in sea water that could have confirmed this hypothesis, but it is consistent with previous modeling and experimental evidence assessing that the large year-to-year variability of atmospheric DMS concentrations can not be explained by changes of meteorological processes controlling the kw factor or by changes of atmospheric oxidants, but most likely by changes in oceanic DMS concentrations (Sciare et al., 2000; Kettle and Andreae, 2000; Marandino et al., 2007; Bock et al., 2021).
Therefore, the DMS concentration in the atmosphere does not seem to be controlled by physical processes at the ocean/atmosphere interface, but is likely related to biological processes in the ocean.
Previous studies found that DMS concentrations in sea water are related to phytoplanktonic biomass (expressed by Chl-a concentration) or to primary productivity that are, in turn, controlling the biogenic aerosol (Minikin et al., 1998; Preunkert et al., 2007).
Some of the highest DMS concentrations in sea water worldwide (>300 nMol L−1) have been reported from the Ross Sea, Antarctica, associated with seasonal blooms of the phytoplankton Phaeocystis antarctica. (Ditullio et al., 2003; Gambaro et al., 2004), a high-DMSP producer (Liss et al., 1994).
Figure 3 shows the time series of measured atmospheric DMS and marine DMSP concentrations and of satellite-derived Chl-a in the two ACs. The satellite determinations of Chl-a are averaged over the region 162.5977∘ E, 77.666∘ S; 171.2109∘ E, 72.2168∘ S, which corresponds to the area of a rectangle 600×300 km covering the polynya area facing MZS. Evidently, the first maxima in Chl-a are followed by increased DMS values in the atmosphere. Also, the first Chl-a double-peak in late November, early December 2019 is higher (1.2–1.8 mg m−3) than the first peak in mid-December of 2018 (0.9 mg m−3). A similar pattern is visible in DMS concentration, with a higher peak in early December 2019 (921 pptV = 37.7 nMol m−3) than in late December 2018 (620 pptV = 25.4 nMol m−3). This seasonal DMS accumulation may be caused by a combination of factors, including high DMS production rates, limitation of bacterial DMS consumption at low temperatures and saturation of biological DMS consumption rates (Ditullio et al., 2003; del Valle et al., 2009).
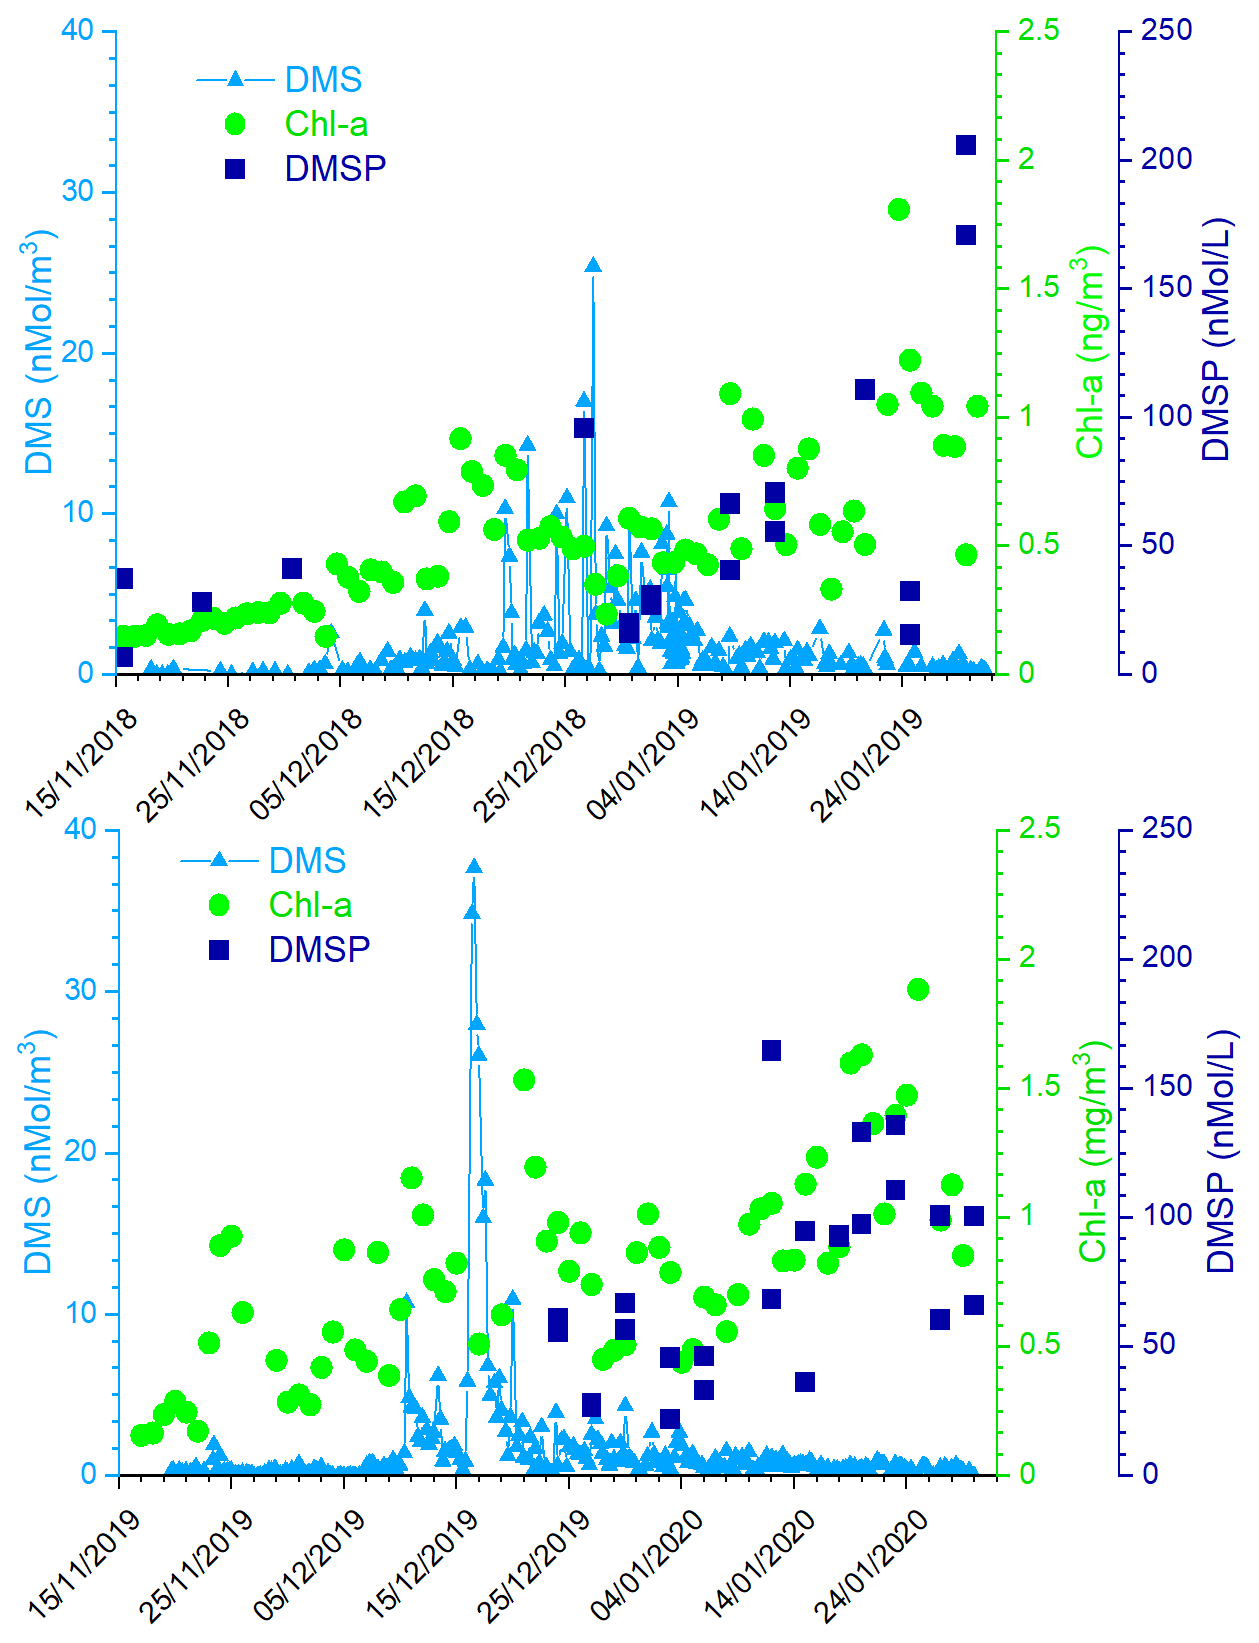
Figure 3Time series of measured atmospheric DMS, DMSP in sea water, and satellite-derived Chl-a (daily, area-averaged concentration in the region 162.5977∘ E, 77.666∘ S; 171.2109∘ E, 72.2168∘ S, corresponding to a rectangle 600×300 km) in the two ACs.
Particularly relevant is the time lag of about 15 d in both Antarctic campaigns between the Chl-a and the DMS peaks. This delay is expected because DMS emissions depend on the physiological state of the phytoplankton. In particular, large emissions are connected with the phytoplanktonic senescent phase associated with stress factors, such as increasing solar radiation due to the shallowing of the depth of the mixing layer (Simó et al., 1999; Vallina and Simó, 2007), consumption of nutrients (Sunda et al., 2007; Zindler et al., 2014), grazing (Savoca and Nevitt, 2014) and bacterial decomposition (Kiene and Bates, 1990; Lomans et al., 2002). The senescent phase, and the DMS emission, generally follows the maximum of phytoplankton biomass coincident with the peak of Chl-a concentration.
It is interesting to note the presence in both the ACs of a second Chl-a peak in January. The Chl-a concentration peak in January is higher than the one in December and it is not associated with an increase in DMS concentrations into the atmosphere (cf. Fig. 3), despite the high concentration of DMSP in surface sea water. To understand this mechanism, the DMS concentration in sea water would have been useful, but as we do not have these measurements, we can speculate that the DMS concentration in the surface ocean at any given time reflects a complex balance between its biological source, bacterial consumption, photochemical oxidation and ventilation to the atmosphere. Regarding the biological source, the difference in community composition, which is dominated by Phaeocystis antarctica in early summer (November–December) when sea ice melts and later by diatoms (Bolinesi et al., 2020; Innamorati et al., 2000), can affect the DMS concentration in sea water in early and late summer. Indeed, it has been shown that in the Ross Sea, the DMS:chl-a ratio (58–78 nMol µg−1) was significantly higher in waters dominated by Phaeocystis antarctica compared to diatom-dominated waters (2–12 nMol µg−1) (DiTullio and Smith, 1995). Regarding the effect of biological DMS consumption, Del Valle et al. (2009) found that while it remained relatively low and constant throughout the spring (0.05–0.21 d−1), it becomes higher in summer (0.22–0.98 d−1; i.e., faster biological turnover). The spring slow biological turnover probably contributed to the DMS buildup during the early bloom, while the fast biological turnover (leading to the formation of DMSO) helped in producing low DMS concentrations in summer (3.2–16.8 nMol L−1). The higher biological DMS consumption in January than in December can explain the apparent anomaly of the higher concentration of DMSP in near-surface sea water and low DMS in the atmosphere. Unfortunately, we could not collect sea water samples during the period of maximum atmospheric DMS concentration due to lack of safe conditions which prevented reaching the open sea.In addition to the different levels of Chl-a and DMS during the two Antarctic campaigns, the Chl-a peaks occurred with a different timing. In particular, in summer 2018–2019, the Chl-a peak occurs later than in the 2019-2020 summer.
It is well known that phytoplanktonic blooms of Phaeocystis antarctica occur at the beginning of sea ice melting (Arrigo et al., 1998; Stefels et al., 2018). Figure 4 shows the sea ice coverage, as determined by satellite observations, in two areas of the Ross Sea, for 2018–2019 and 2019–2020. When the whole Ross Sea area is considered (an area about 800×800 km2), it appears that the ice cover is higher in 2019–2020 than in 2018–2019, which seems in contrast to the timing of Chl-a increases. However, analyzing in detail the area of the polynya facing the sampling site (about 100×100 km2 wide), we may observe that sea ice starts melting earlier and decreases faster in 2019–2020 than the previous year. This evolution of sea ice in the region surrounding MZS could produce a shorter but more intense phytoplanktonic bloom in the polynya area in 2019–2020, and seems to be consistent with the observed evolution of DMS and related parameters. This suggests that the polynya areas close to MZS play a dominant role for the phytoplanktonic cycle and production of biogenic aerosol precursors.
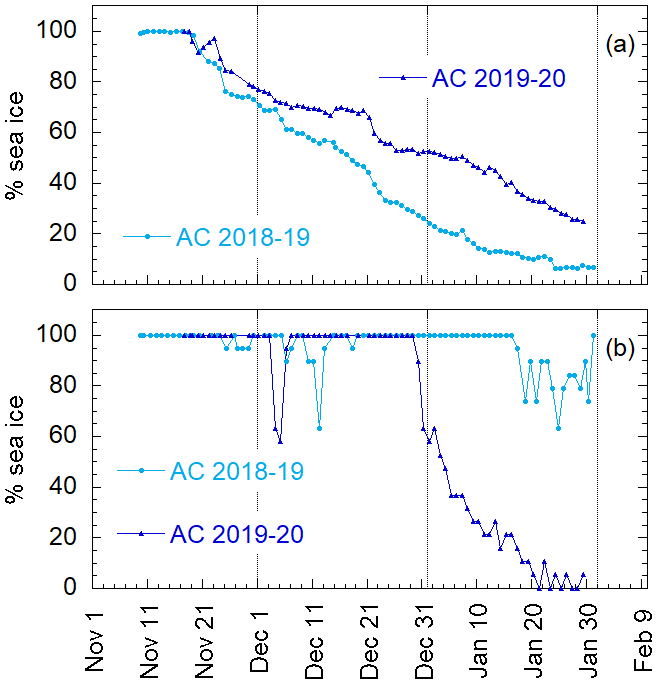
Figure 4Percentage of the area covered by sea ice for the (a) Ross Sea (800×800 km2) and (b) the restricted area of polynya in the Ross Sea (100×100 km2) for the two ACs.
3.2 The relationship between DMS and its oxidation products (MSA and nssSO2-4): a schematic representation of mechanisms
The simultaneous measurements of atmospheric DMS and its oxidation products allow us to study the dynamic processes occurring in the atmosphere leading to the formation of biogenic particulate matter. These processes can be summarized by the simple model reported in Fig. 5, where the box represent the atmosphere over the sampling site (and relative concentration of DMS, MSA and nssSO2-4). FDMS, FMSA and FnssSO4 are the flux of DMS, MSA and nssSO2-4 incoming (F-in), outcoming (F-out) or formation (Fox). DMSsw and DMSLR represent the concentration of DMS in sea water and from sea water far from the sampling site (long-range), respectively. MSALR and nssSO2-4LR represent the concentration of long-range transported species and nssSO2-4volc. represent the volcanic nssSO2-4.
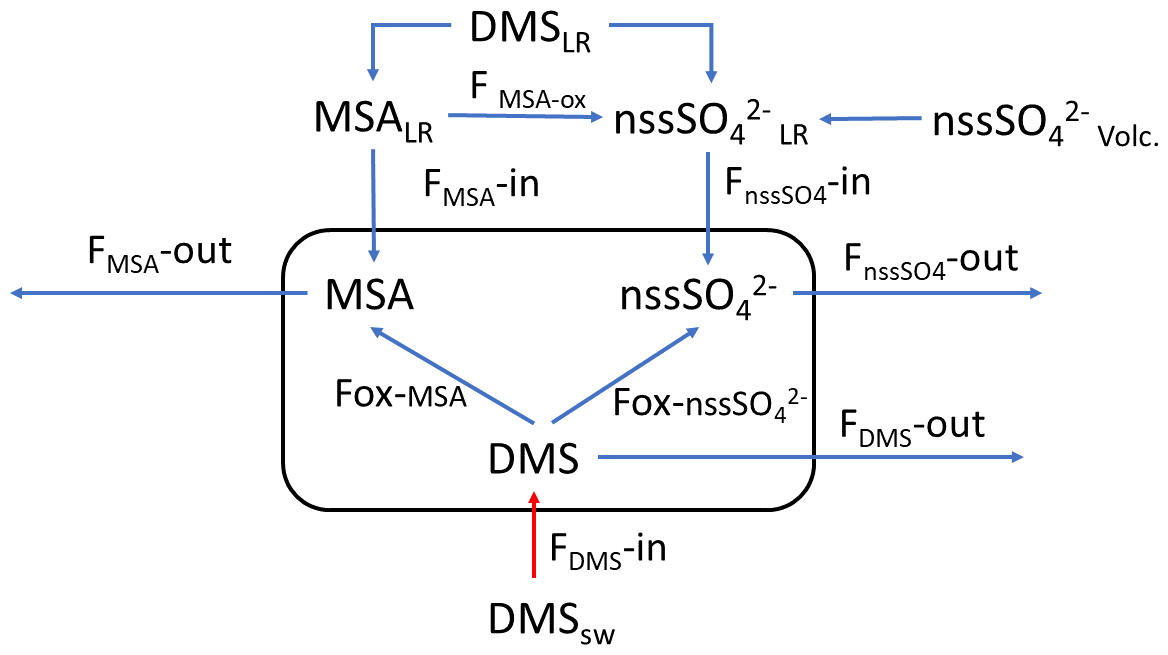
Figure 5Schematic representation of the processes related to the measured concentration of DMS, MSA and nssSO2-4 at MZS. See text for the abbreviations' meaning.
In this section, we discuss the overall evolution of DMS, MSA and nssSO2-4 and their relationships, with the aim of identifying periods for which occurring processes with respect to the DMS oxidation pathways can be determined. Specific periods in which near/far sources of the different compounds and oxidation processes for different DMS emission conditions are identified and discussed as explanatory cases.
Figure 2 shows that in both ACs, MSA displays a time evolution similar to nssSO2-4 with simultaneous peaks. Conversely, the time evolution of MSA and nssSO2-4 differs from that of DMS in the two ACs: (i) during the 2019–2020 AC, maxima of biogenic aerosol compounds occur with a short time difference (24 h) with respect to the DMS peaks and (ii) during the 2018–2019 AC, the largest MSA and nssSO2-4 peak occurs one month later than DMS.
In the period 15–18 December 2019 (Fig. 6), MSA and nssSO2-4 maxima are associated with DMS. This case offers an exceptional example to understand the dynamics of biogenic aerosol formation. In this period, air masses arrived from the area of the Ross Sea surrounding the sampling site (Fig. 7a) passing at low height on the near-sea areas not covered by sea ice, therefore, in correspondence with strong DMS emissions from sea water. The wind speed and direction are almost constant at about 10 m s−1 from the marine sector (180–220∘ N). The measured relative humidity is 100 % and UV radiation is attenuated by clouds until 17 December at 00:00 (Fig. 6). Looking at the scheme in Fig. 5 from 16 to 17 December 2019, we assumed that FDMS-in is constant and quite high; at the beginning of DMS emission (16 December 2019), Fox-MSA and Fox-nssSO4 just started; therefore, the concentration of DMS in the box depends on the equilibrium between FDMS-in and FDMS-out. At this wind speed, FDMS-out is probably low with respect to FDMS-in, as the concentration DMSsw (driving the sea-air flux) is high. In these conditions, the DMS concentration reached a maximum of 32.8 nMol m−3 on 16 December (the average over the period 09:00–21:00 LT). Due to the constant wind speed and direction (Fig. 6), we can assume that DMS emission from the ocean remains constant also in the following days (DMSemitted), when UV radiation increase in the following 24 h stimulated the DMS oxidation processes, Fox-MSA and Fox-nssSO4 become relevant and at constant FDMS-in and FDMS-out, the concentration of MSA and nssSO2-4 increases and DMS decreases. MSA and nssSO2-4 reached the maximum concentration on 17 December (8.3 and 9.9 nMol m−3 for MSA and nssSO2-4, respectively, for the sampling time 09:00–21:00 LT) when the DMS concentration was 12.6 nMol m−3.
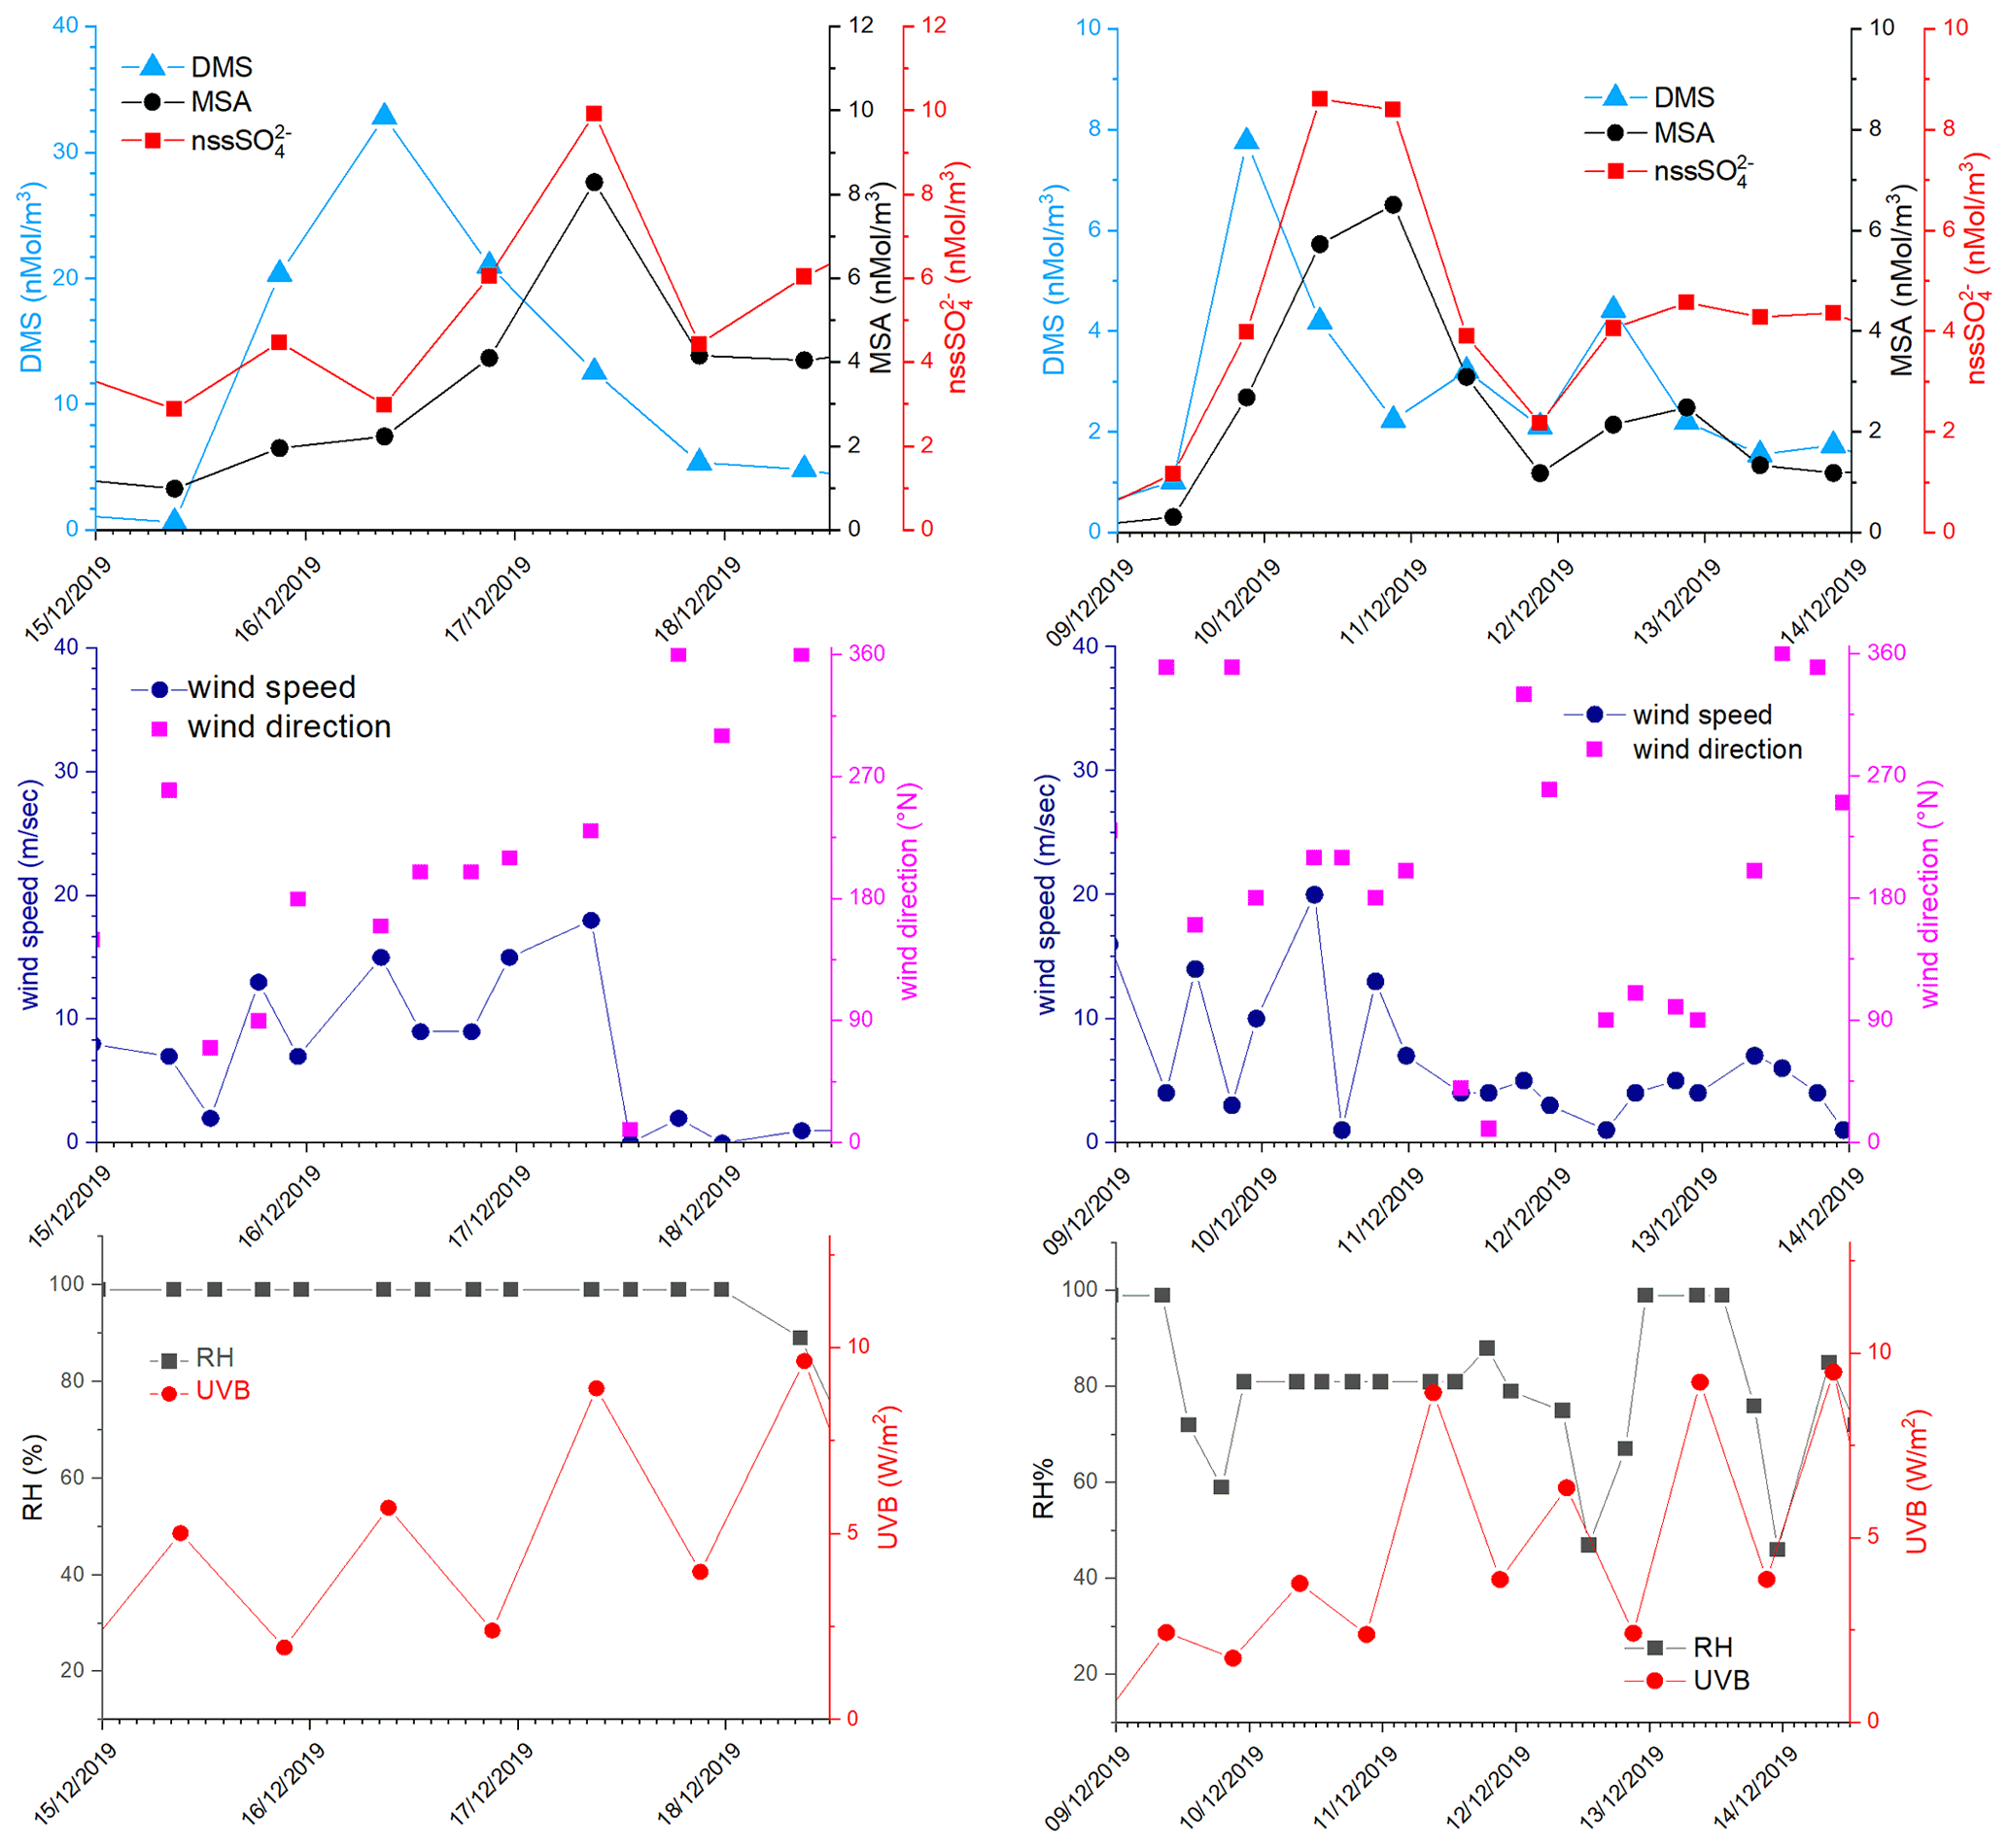
Figure 6DMS, MSA and nssSO2-4, wind speed and direction, relative humidity (RH) and UVB for the time 15–19 December 2019 and 9–14 December 2019. DMS and UV-B data are averaged over the time interval of the corresponding aerosol sampling (12 h).
Therefore, the 17 December in the box of Fig. 5 should have
If DMSemitted=32.8 nMol m−3 and DMS in the box is 12.6 nMol m−3,
But the DMSlost is due to the formation of MSA and nssSO2-4, therefore,
DMSlost= MSA + nssSO2-4 =8.3+9.9=18.2 nMol m−3 that is in agreement with the value of 20.2 previously calculated with the approximation of the constant DMS emission for these days.
Therefore, in this situation of constant wind speed and direction for the 17 December, we can suppose that FMSA and FnssSO42− in and out are negligible and the concentration of MSA and nssSO2-4 in the box are mainly due to the Fox-MSA and Fox-nssSO2-4, for this reason, reflecting the MSA/nssSO2-4 ratio of freshly formed biogenic aerosol.
On the following day (18 December), the abrupt change of wind direction (Fig. 5) transport on the sampling site different air masses, therefore, progressively increasing FDMS-out, FMSA-out FnssSO4-out, leading to MSA, nssSO2-4 and DMS concentration decreases in the box of Fig. 5.
On the days 16–17 December, the MSA/nssSO2-4 ratio ranges from 0.68 to 0.94 mol mol−1. As reported by Fung et al. (2022), the BrO reaction with DMS in the gas phase and O3 reaction in the aqueous phase are the two main processes for DMS loss in the southern high-latitude ocean, accounting for 50 %–60 % and 20 %–30 %, respectively. Both these processes lead to the formation of MSA in the aerosol phase (Fung et al., 2022). In particular, the reaction with O3 in the aqueous phase could be particularly efficient at this time when high relative humidity is measured (100 %). This high MSA/nssSO2-4 ratio can be measured only in the freshly formed secondary biogenic aerosol, as MSA in the aerosol phase can be transformed in nssSO2-4 by reaction with OH radicals (Fung et al., 2022), leading to a decrease of the MSA/nssSO2-4 ratio in the aged aerosol.
A similar situation occurred also in the period 9–15 December 2019 and 3–7 January 2020 (the latter reported as an example in Fig. 6 and the corresponding backward trajectories in Fig. 7b), even though with a different intensity of DMS emissions.

Figure 7Ensemble of 10-day backward trajectories at 300 m a.g.l. (above ground level) arrival height for the days 16 December 2019 (a), 4 January 2020 (b), 10 December 2018 (c), 26 December 2018 (d), 9 January 2019 (e) and 15 January 2019, (f) together with the ice cover for these days. Trajectory height along the route and sea ice percentage are presented as color or gray scales, respectively.
In the 2018–2019 AC, conversely, MSA and nssSO2-4 maxima do not strictly coincide with high DMS concentrations. In particular, the first peaks of MSA and nssSO2-4 occur on 10–11 December 2018, about 10 d before the main DMS peak. Sea ice is still present near the sampling site and DMS can not escape locally to the atmosphere, therefore, FDMS-in (cifr. Fig. 5) is low and, therefore, the concentration of DMS in the atmosphere (represented by the box in Fig. 5) is also low. At this time, MSA and nssSO2-4 were very likely transported from areas far from the sampling site (i.e., MSALR and nssSO2-4LR – Fig. 5), where an early phytoplankton bloom was taking place likely due to the sea ice melting in the external boundary of the sea ice belt around Antarctica (Gabric et al., 2005, 2018). Backward trajectories show air masses coming from the ice sheet (cf. Fig. 7c); therefore, we can suppose that MSA and nssSO2-4 came from oceanic sectors far from the sampling site. In this period, the MSA/nssSO2-4 ratio was quite low (about 0.2), indicating generally aged air masses.
In the period 19–30 December 2018, several DMS peaks were measured, associated with low or moderate MSA and nssSO2-4 concentrations (Fig. 8). In this period, DMS emissions from the ocean are expected to be high and to be captured by the air masses traveling over the sea. This period is characterized by high wind speeds; DMS concentration spikes are higher when wind speed drops (Fig. 8). In this case, due to the high variability of wind speed with values up to 25–30 m s−1 FDMS−in (Fig. 5) can be high, but in this condition, FDMS-out (Fig. 5)is also high. Therefore, the DMS-laden air masses are transported away before a relevant amount of product (MSA and nssSO2-4) are formed. Therefore, even if a small amount of measured MSA and nssSO2-4 in the atmosphere (i.e. box in Fig. 5) can come from Fox-MSA and Fox-nssSO4, the main part comes from FMSA-LR and FnssSO4-LR. As nssSO2-4LR can arise from the further oxidation of MSA in the water phase along the transport (FMSA-ox, Fung et al., 2022) and from volcanic sources (nssSO2-4volc.), the measured MSA/nssSO2-4 ratio is lower and more variable with respect to those measured in freshly formed biogenic aerosol. The backward trajectories show that air masses came from the Weddell Sea, far from the sampling site (Fig. 7d), crossing the ice sheet and passing at low elevation over the Terra Nova Bay polynya just before arriving at the sampling site. The presence of generally aged air masses in this period is confirmed by the low MSA/nssSO2-4 ratio (0.35, on average). Therefore, in these periods, air masses containing MSA and nssSO2-4 came from an oceanic sector far from the sampling site, whereas the DMS enters the air mass over the polynya just before the sampling site.

Figure 8DMS, MSA and nssSO2-4, wind speed and direction, relative humidity (RH) and short-wave irradiance for the time 19–30 December 2018 and 9–20 January 2019. DMS and SW irradiance data are averaged over the same time interval of the aerosol sampling (12 h).
In the two periods 9–13 and 15–18 January 2019, high MSA and nssSO2-4 concentrations (>5 nMol m−3) are measured, while DMS concentrations are very low (<3 nMol m−3). In these periods, the wind speed was very low (<5 m s−1) (Fig. 8). Backward trajectories show air masses coming from the ice sheet for the period 9–13 January (Fig. 7e) and routes extremely variable sometimes coming from the northern part of the Ross Sea uncovered by ice at this time (Fig. 7f). Indeed, the MSA/nssSO2-4 ratio is quite low on 9–13 January (0.40 Mol Mol−1) when air masses come from the ice sheet and, therefore, far from the sampling site, while it reaches the highest measured value (up to 0.96 Mol Mol−1) during 15–18 January. This suggests the presence of freshly formed biogenic aerosol from DMS formed in the northernly Ross Sea.
3.3 Quantification of the biogenic aerosol contribution to PM10
In the previous section, we highlighted the variability of the MSA/nssSO2-4 ratio as a function of the air masses' aging. In order to find a characteristic branch ratio for the DMS oxidation, the MSA concentrations are reported versus nssSO2-4 concentrations in Fig. 9. A somewhat different pattern of MSA concentration with respect to nssSO2-4 concentrations appears. We separated data into two classes respectively for nssSO2-4 values lower and higher than the somewhat arbitrary value of 3 nMol m−3. The slope of the MSA-nssSO2-4 relationship appears to change approximately around this value. Small changes in the results that will be discussed occur when a different threshold value in the range 2.5–4 nMol m−3 is chosen.
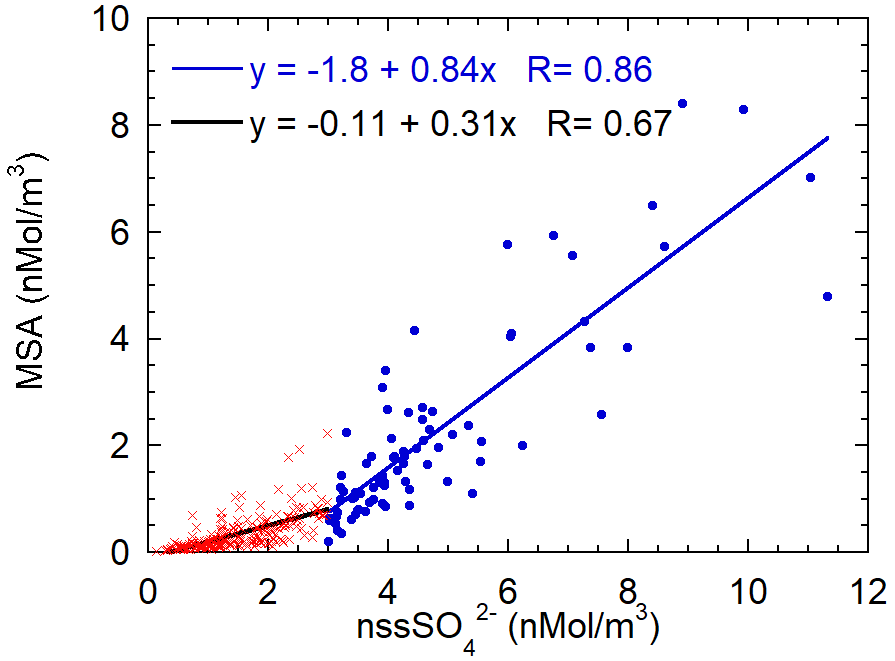
Figure 9Scatterplot of MSA concentrations versus nssSO2-4. The two regression lines are calculated for the nssSO2-4 concentration lower (red crosses, black line) and higher (blue dots and line) than 3 nMol m−3.
The value of the threshold allows us to split the dataset in a low and high biogenic aerosol load. The presence or high or low biogenic aerosol load is related both to the air masses' direction and timing. About 60 % of data with a nssSO2-4 concentration lower than 3 nMol m−3 come from the ice sheet (direction from 200–350∘ N, as reported above) and the remaining 40 % are related to a time before the beginning of sea-ice melt and, therefore, before the phytoplanktonic bloom.
MSA shows a relatively high correlation with nssSO2-4 for both datasets (even though the correlation is worse for low nssSO2-4 concentrations), suggesting that both species have a common source, as expected for DMS oxidation. The slope of the regression line is higher for the class with nssSO2-4 > 3 nMol m−3. The two different slopes can be associated with different situations: for nssSO2-4-concentrations below 3 nMol m−3, the MSA-nssSO2-4 relationship is expected to be produced by aged biogenic aerosol with possible additional nssSO2-4 contributions coming from the oxidation of SO2 emitted by the near volcano Erebus (Boichu et al., 2010) (Fig. 1) or from long-range transport from northern latitudes (Minikin et al., 1998).
Conversely, nssSO2-4 values higher than 3 nMol m−3 appear to be generally associated with the presence of freshly formed biogenic aerosol. The abscissa-intercept of the regression line is 2.1 nMol m−3, corresponding to 202 ng m−3. Once this background contribution is subtracted, the MSA/nssSO2-4 derived from the regression line is 0.84±0.06 Mol Mol (that is the same value expressed as w/w as MSA and SO2-4 have almost the same molar mass). We assume that this value can be considered as the mean branch ratio between the two species in the newly formed biogenic aerosol in summer at this high southern latitude. Several other studies report quite different MSA/nssSO2-4 ratios, both in aerosol and snow layers (Becagli et al., 2005; Legrand and Pasteur, 1998; Minikin et al., 1998; Mulvaney and Wolff, 1994; Preunkert et al., 2008; Zhang et al., 2015). However, some of these determinations are affected by fractionation effects in the aerosol during the transport from source regions to the sampling site and by different deposition processes. In this study, thanks to the closeness and strength of the DMS source during periods of ice-free polynya in the short-range of the sampling site and to the opportunity to find air masses containing DMS and both its freshly formed oxidation products, we believe that it is possible to obtain a characteristic MSA/nssSO2-4 branch ratio for the freshly formed biogenic sulfur-oxidized aerosol.
Considering the samples when nssSO2-4 is higher than 3 nMol m−3 as representative of the presence of freshly formed biogenic aerosol, is it thus possible to quantify the role played by newly formed biogenic aerosol on the total PM10 mass. On average, the sum of biogenic nssSO2-4 (i.e., by subtracting the nssSO2-4 background) and MSA accounts for 17 % of the PM10 mass, with maxima in single samples as high as 56 %. This contribution is relevant and its quantification is important also from a climatic point of view, as freshly formed biogenic aerosol can constitute an important source of cloud condensation nuclei over the Southern Ocean.
Simultaneous high time-resolution measurements of sulfur compounds have been collected at a coastal Antarctic site (MZS) during two summer campaigns (2018–2019 and 2019–2020) to provide information on marine biological activity in the nearby polynya in the Ross Sea and on the influence of biogenic and atmospheric processes on biogenic aerosol formation.
Data on atmospheric DMS concentration are scarce, especially in Antarctica. The DMS maximum at MZS occurs in December, 1 month earlier than at the other sites at lower southern latitudes where measurements are available. The maximum of DMS concentration appears to be connected with the phytoplanktonic senescent phase following the bloom of Phaeocystis antarctica that occurs in the polynya area closest to the sampling site when sea ice opens up.
The second plankton bloom is related to diatoms and occurs in January. During this bloom, despite the high DMSP concentration in sea water, atmospheric DMS remained low, probably due to its fast biological turnover in sea water in this period (del Valle et al., 2009). DMS measurements in sea water may help elucidate the connection between Chl-a, DMSP in the ocean and DMS into the atmosphere.
The intensity and timing of the DMS evolution during the two years also suggest that only the portion of the polynya close to the sampling site produces a discernible effect on the measured DMS.
Several studies highlight the necessity to determine the branch ratio between MSA and nssSO2-4 from DMS oxidation at high latitudes. However, the DMS oxidation responds to multiple processes and controllers, including concentration of atmospheric oxidants and meteorological factors; therefore, the values of the branch ratio found in the literature varies considerably (e.g., Bates et al., 1992; Preunkert et al., 2008; Yan et al., 2020). In this study, the closeness to the DMS source area and the occurrence of air masses containing DMS and freshly formed oxidation products allow a reliable derivation of the branch ratio. The MSA/nssSO2-4 branch ratio for newly formed biogenic aerosol is estimated to be 0.84±0.06.
Conversely, data suggest that for aged air masses with low DMS content, an enrichment of nssSO2-4 with respect to MSA occurs, due to the presence of background concentration of nssSO2-4 from volcanic origin (Erebus) or coming from long-range transport where part of MSA is converted in nssSO2-4 in the aqueous phase by radical OH. Therefore, the aged air mass presents an MSA/nssSO2-4ratio lower than in newly formed biogenic aerosol.
By considering the sum of MSA and biogenic nssSO2-4 in periods impacted by fresh biogenic aerosol, we estimate that the mean contribution of biogenic particulate matter to PM10 is 17 % with a maximum of 56 %. The high contribution of biogenic aerosol to the total PM10 mass in summer in this area highlights the dominant role of the polynya area on biogenic aerosol formation. This is especially important due to the possible relevant role played by this aerosol in CCN formation.
Finally, due to the regional and year-to-year variability of DMS and related biogenic aerosol formation, we stress the need for long-term DMS measurements, both in sea water and into the atmosphere, together with biogenic aerosol along the Antarctic coast and in the Southern Ocean. This is particularly important in this phase in which increasing temperatures and fast changes of ice distribution and properties are expected to affect other environmental parameters, such as primary productivity, formation of biogenic aerosols, and consequent climate-related parameters.
Data are available on request to the corresponding authors.
SB, RT, LL and AdS designed the study. SB, LC, MV, and CM, collected the samples and made the DMS measurements in Antarctica. KTP, LC, CN, MS, RZ, EB, MF performed laboratory measurements. PG, SiB, MM, AM, ML, SP, DM, GP played key roles in the collection and analysis of the data campaigns. JH, LL and AdS elaborated satellite data and backward trajectories calculation. JH, LL, RT and AdS supported with the data interpretation and validation. SB wrote the manuscript with contributions of all authors. All the authors contributed to the discussion of the results as well as the finalization of the manuscript.
The contact author has declared that neither of the authors has any competing interests.
Publisher's note: Copernicus Publications remains neutral with regard to jurisdictional claims in published maps and institutional affiliations.
We would like to thank the National Snow and Ice Data Center (NSIDC) funded through the NASA Earth Science Data and Information System (ESDIS) project and the Global Data Assimilation System (GDAS1) provided by the US National Weather Service's National Centers for Environmental Prediction (NCEP) for archiving and publishing the data.
Special thanks to the logistic and scientific staff at “Mario Zucchelli Station” in Antarctic campaigns 2018-19 and 2019-20; without them this work could not have been accomplished.
This research has been supported by the MIUR (Italian Ministry of University and Research) and PNRA (Programma Nazionale di Ricerca in Antartide) through the Project “Correlation between biogenic aerosol and primary production in the Ross Sea-BioAPRoS” (grant no. PNRA16_00065-A1). Meteorological data are furnished by the “Meteo-Climatological Observatory at MZS and Victoria Land” project funded by the PNRA (grant no. PNRA14_00019) and managed by staff of the Italian National Agency for New Technologies, Energy and Sustainable Economic Development (ENEA, http://www.climantartide.it/, last access: 15 September 2021).
This paper was edited by Katye Altieri and reviewed by Albert Gabric and C. A. Marandino.
Andreae, M. O. and Barnard, W. R.: The marine chemistry of dimethylsulfide, Mar. Chem., 14, 267–279, https://doi.org/10.1016/0304-4203(84)90047-1, 1984.
Asher, E. C., Dacey, J. W. H., Stukel, M., Long, M. C., and Tortell, P. D.: Processes driving seasonal variability in DMS, DMSP, and DMSO concentrations and turnover in coastal Antarctic waters, Limnol. Oceanogr., 62, 104–124, 2017.
Ardyna, M., Claustre, H., Sallée, J. B., D'Ovidio, F., Gentili, B., van Dijken, G., D'Ortenzio, F., and Arrigo, K. R.: Delineating environmental control of phytoplankton biomass and phenology in the Southern Ocean, Geophys. Res. Lett., 44, 5016–5024, https://doi.org/10.1002/2016GL072428, 2017.
Arrigo, K. R. and van Dijken, G. L.: Phytoplankton dynamics within 37 Antarctic coastal polynya systems, J. Geophys. Res.-Ocean., 108, 3271, https://doi.org/10.1029/2002JC001739, 2003.
Arrigo, K. R., Weiss, A. M., and Smith, W. O.: Physical forcing of phytoplankton dynamics in the southwestern Ross Sea, J. Geophys. Res.-Ocean., 103, 1007–1021, https://doi.org/10.1029/97jc02326, 1998.
Arrigo, K. R., Lowry, K. E., and van Dijken, G. L.: Annual changes in sea ice and phytoplankton in polynyas of the Amundsen Sea, Antarctica, Deep. Res. Part II – Top. Stud. Oceanogr., 71–76, 5–15, https://doi.org/10.1016/j.dsr2.2012.03.006, 2012.
Barnard, W. R., Andreae, M. O., and Iverson, R. L.: Dimethylsulfide and Phaeocystis poucheti in the southeastern Bering Sea, Cont. Shelf Res., 3, 103–113, https://doi.org/10.1016/0278-4343(84)90001-3, 1984.
Bates, T. S., Calhoun, J. A., Quinn, P. K.: Variations in the methanesulfonate to sulfate molar ratio in submicrometer marine aerosol particles over the south Pacific Ocean, 97, 9859–9865, https://doi.org/10.1029/92JD00411, 1992.
Becagli, S., Proposito, M., Benassai, S., Gragnani, R., Magand, O., Traversi, R., and Udisti, R.: Spatial distribution of biogenic sulphur compounds (MSA, nssSO<inf>4</inf>2−) in the northern Victoria Land-Dome C-Wilkes Land area, East Antarctica, Ann. Glaciol., 41, 23–31, https://doi.org/10.3189/172756405781813384, 2005.
Becagli, S., Marchese, C., Caiazzo, L., Ciardini, V., Lazzara, L., Mori, G., Nuccio, C., Scarchilli, C., Severi, M., and Traversi, R.: Biogenic aerosol in central East Antarctic Plateau as a proxy for the ocean-atmosphere interaction in the Southern Ocean, Sci. Total Environ., 810, 151285, https://doi.org/10.1016/j.scitotenv.2021.151285, 2022.
Bell, T. G., Landwehr, S., Miller, S. D., de Bruyn, W. J., Callaghan, A. H., Scanlon, B., Ward, B., Yang, M., and Saltzman, E. S.: Estimation of bubble-mediated air-sea gas exchange from concurrent DMS and CO2 transfer velocities at intermediate-high wind speeds, Atmos. Chem. Phys., 17, 9019–9033, https://doi.org/10.5194/acp-17-9019-2017, 2017.
Belviso, S., Moulin, C., Bopp, L., and Stefels, J.: Assessment of a global climatology of oceanic dimethylsulfide (DMS) concentrations based on SeaWiFS imagery (1998–2001), Can. J. Fish. Aquat. Sci., 61, 804–816, https://doi.org/10.1139/F04-001, 2004.
Bock, J., Michou, M., Nabat, P., Abe, M., Mulcahy, J. P., Olivié, D. J. L., Schwinger, J., Suntharalingam, P., Tjiputra, J., van Hulten, M., Watanabe, M., Yool, A., and Séférian, R.: Evaluation of ocean dimethylsulfide concentration and emission in CMIP6 models, Biogeosciences, 18, 3823–3860, https://doi.org/10.5194/bg-18-3823-2021, 2021.
Boden, R., Murrell, J. C., and Schäfer, H.: Dimethylsulfde is an energy source for the heterotrophic marine bacterium Sagittula stellata, FEMS Microbiol. Lett. 322, 188–193, 2011.
Boichu M., Oppenheimer C., Tsanev V., Kyle P. R.: High temporal resolution SO2 flux measurements at Erebus volcano, Antarctica, J. Volcanol. Geoth. Res., 190, 325–336, https://doi.org/10.1016/j.jvolgeores.2009.11.020, 2010.
Bolinesi, F., Saggiomo, M., Ardini, F., Castagno, P., Cordone, A., Fusco, G., Rivaro, P., Saggiomo, V., and Mangoni, O.: Spatial-Related Community Structure and Dynamics in Phytoplankton of the Ross Sea, Antarctica, Front. Mar. Sci., 7, 1–20, https://doi.org/10.3389/fmars.2020.574963, 2020.
Cameron-Smith, P., Elliott, S., Maltrud, M., Erickson, D., and Wingenter, O.: Changes in dimethyl sulfide oceanic distribution due to climate change, Geophys. Res. Lett., 38, L07704, https://doi.org/10.1029/2011GL047069, 2011.
Charlson, R. J., Lovelockt, J. E. Andreae, M. O., and Warren, S. G.: Oceanic phytoplankton, atmospheric sulphur, cloud albedo and climate, Nature, 326, 655–661, 1987.
Cole, H. S., Henson, S., Martin, A. P., and Yool, A.: Basin-wide mechanisms for spring bloom initiation: how typical is the North Atlantic?, ICES J. Mar. Sci., 72, 2029–2040, https://doi.org/10.1093/ICESJMS/FSU239, 2015.
Criscitiello, A. S., Das, S. B., Evans, M. J., Frey, K. E., Conway, H., Joughin, I., Medley, B., and Steig, E. J.: Ice sheet record of recent sea-ice behavior and polynya variability in the Amundsen Sea, West Antarctica, J. Geophys. Res.-Ocean, 118, 118–130, https://doi.org/10.1029/2012JC008077, 2013.
Dall'Osto, M., Beddows, D. C. S., Tunved, P., Krejci, R., Ström, J., Hansson, H. C., Yoon, Y. J., Park, K. T., Becagli, S., Udisti, R., Onasch, T., Ódowd, C. D., Simó, R., and Harrison, R. M.: Arctic sea ice melt leads to atmospheric new particle formation, Sci. Rep., 7, 1–10, https://doi.org/10.1038/s41598-017-03328-1, 2017.
del Valle, D. A., Kieber, D. J., Toole, D. A., Brinkley, J., and Kienea, R. P.: Biological consumption of dimethylsulfide (DMS) and its importance in DMS dynamics in the Ross Sea, Antarctica, Limnol. Oceanogr., 54, 785–798, https://doi.org/10.4319/lo.2009.54.3.0785, 2009.
Deng, X., Chen, J., Hansson, L. A., Zhao, X., and Xie, P.: Eco-chemical mechanisms govern phytoplankton emissions of dimethylsulfide in global surface waters, Natl. Sci. Rev., 8, 4–11, https://doi.org/10.1093/nsr/nwaa140, 2021.
di Sarra, A., Fua, D., Cacciani, M., Di lorio, T., Disterhoft, P., Meloni, D., Monteleone, F., Piacentino, S., and Sferlazzo, D.: Determination of ultraviolet cosine-corrected irradiances and aerosol optical thickness by combined measurements with a Brewer spectrophotometer and a multifilter rotating shadowband radiometer, Appl. Opt., 47, 6142–6150, https://doi.org/10.1364/AO.47.006142, 2008.
di Sarra, A., Bommarito, C., Anello, F., Di Iorio, T., Meloni, D., Monteleone, F., Pace, G., Piacentino, S., Sferlazzo, D.: Assessing the quality of shortwave and longwave irradiance observations over the ocean: One year of high-time-resolution measurements at the Lampedusa oceanographic observatory, J. Atmos. Ocean. Technol., 36, 2383–2400, https://doi.org/10.1175/JTECH-D-19-0018.1, 2019.
Ditullio, G. R., Jones, D. R., and Geesey, M. E.: Dimethylsulfide Dynamics in the Ross Sea During Austral Summer,” in Biogeochemistry of the Ross Sea (American Geophysical Union (AGU)), 279–293, 2003.
DiTullio, G. R. and Smith, W. O.: Relationship between dimethylsulfide and phytoplankton pigment concentrations in the Ross Sea, Antarctica, Deep. Res. Part I, 42, 873–892, https://doi.org/10.1016/0967-0637(95)00051-7, 1995.
Ducklow, H. W., Baker, K., Martinson, D. G., Quetin, L. B., Ross, R. M., Smith, R. C., Stammerjohn, S. E., Vernet, M., and Fraser, W.: Marine pelagic ecosystems: The West Antarctic Peninsula, Philos. Trans. R. Soc. B, 362, 67–94, https://doi.org/10.1098/rstb.2006.1955, 2007.
Faloona, I.: Sulfur processing in the marine atmospheric boundary layer: A review and critical assessment of modeling uncertainties, Atmos. Environ., 43, 2841–2854, https://doi.org/10.1016/J.ATMOSENV.2009.02.043, 2009.
Fetterer, F., Knowles, K., Meier, W., Savoie, M., and Windnagel, A. K.: Sea Ice Index, Version 3, NSIDC National Snow and Ice Data Center, Boulder, CO, https://doi.org/10.7265/N5K072F8, 2017.
Froelich, P. N., Kaul, L. W., Byrd, J. T., Andreae, M. O., and Roe, K. K.: Arsenic, barium, germanium, tin, dimethylsulfide and nutrient biogeochemistry in Charlotte Harbor, Florida, a phosphorus-enriched estuary, ECSS, 20, 239–264, https://doi.org/10.1016/0272-7714(85)90041-1, 1985.
Fung, K. M., Heald, C. L., Kroll, J. H., Wang, S., Jo, D. S., Gettelman, A., Lu, Z., Liu, X., Zaveri, R. A., Apel, E. C., Blake, D. R., Jimenez, J.-L., Campuzano-Jost, P., Veres, P. R., Bates, T. S., Shilling, J. E., and Zawadowicz, M.: Exploring dimethyl sulfide (DMS) oxidation and implications for global aerosol radiative forcing, Atmos. Chem. Phys., 22, 1549–1573, https://doi.org/10.5194/acp-22-1549-2022, 2022.
Gabric, A. J., Qu, B., Matrai, P., and Hirst, A.: The simulated response of dimethylsulfide production in the Arctic Ocean to global warming, Tellus B – Chem. Phys. Meteorol., 57, 391–403, https://doi.org/10.3402/tellusb.v57i5.16564, 2005.
Gabric, A. J., Qu, B., Matrai, P. A., Murphy, C., Lu, H., Lin, D. R., Qian, F., and Zhao, M.: Investigating the coupling between phytoplankton biomass, aerosol optical depth and sea-ice cover in the Greenland Sea, Dynam. Atmos. Ocean., 66, 94–109, https://doi.org/10.1016/J.DYNATMOCE.2014.03.001, 2014.
Gabric, A., Matrai, P., Jones, G., and Middleton, J.: The nexus between sea ice and polar emissions of marine biogenic aerosols, B. Am. Meteorol. Soc., 99, 61–81, https://doi.org/10.1175/BAMS-D-16-0254.1, 2018.
Gambaro, A., Moret, I., Piazza, R., Andreoli, C., Rin, E. D. A., Capodaglio, G., Barbante, C., and Cescon, P.: Temporal evolution of DMS and DMSP in Antarctic Coastal Sea water, Int. J. Environ. Anal. Chem., 84, 401–412, https://doi.org/10.1080/03067310310001636983, 2004.
Gondwe, M., Krol, M., Gieskes, W., Klaassen, W., and De Baar, H.: The contribution of ocean-leaving DMS to the global atmospheric burdens of DMS, MSA, SO2, and NSS-SO=4, Global Biogeochem. Cy., 17, 1056, https://doi.org/10.1029/2002GB001937, 2003.
Henderson, P. and Henderson, G. M.: The Cambridge Handbook of Earth Science Data, Cambridge University Press, 277, ISBN 0521693179, 2009.
Hezel, P. J., Alexander, B., Bitz, C. M., Steig, E. J., Holmes, C. D., Yang, X., and Sciare, J.: Modeled methanesulfonic acid (MSA) deposition in Antarctica and its relationship to sea ice, J. Geophys. Res.-Atmos., 116, 1–18, https://doi.org/10.1029/2011JD016383, 2011.
Hulswar, S., Simo, R., Galí, M., Bell, T., Lana, A., Inamdar, S., Halloran, P. R., Manville, G., and Mahajan, A. S.: Third Revision of the Global Surface Seawater Dimethyl Sulfide Climatology (DMS-Rev3), Earth Syst. Sci. Data Discuss. [preprint], https://doi.org/10.5194/essd-2021-236, in review, 2021.
Innamorati, M., Mori, G., Massi, L., Lazzara, L., and Nuccio, C.: Phytoplankton Biomass Related to Environmental Factors in the Ross Sea, Ross Sea Ecol., 217–230, https://doi.org/10.1007/978-3-642-59607-0_18, 2000.
Jang, E., Park, K. T., Yoon, Y. J., Kim, K., Gim, Y., Chung, H. Y., Lee, K., Choi, J., Park, J., Park, S. J., Koo, J. H., Fernandez, R. P., and Saiz-Lopez, A.: First-year sea ice leads to an increase in dimethyl sulfide-induced particle formation in the Antarctic Peninsula, Sci. Total Environ., 803, 150002, https://doi.org/10.1016/J.SCITOTENV.2021.150002, 2022.
Jarníková, T., Tortell, P. D., Jarníková, T., and Tortell, P. D.: Towards a revised climatology of summertime dimethylsulfide concentrations and sea–air fluxes in the Southern Ocean, Environ. Chem., 13, 364–378, https://doi.org/10.1071/EN14272, 2016.
Jourdain, B. and Legrand, M.: Seasonal variations of atmospheric dimethylsulfide, dimethylsulfoxide, sulfur dioxide, methanesulfonate, and non-sea-salt sulfate aerosols at Dumont d'Urville (coastal Antarctica) (December 1998 to July 1999), J. Geophys. Res.-Atmos., 106, 14391–14408, https://doi.org/10.1029/2000JD900841, 2001.
Kettle, A. J. and Andreae, M. O.: Flux of dimethylsulfide from the oceans: A comparison of updated data sets and flux models, J. Geophys. Res.-Atmos., 105, 26793–26808, https://doi.org/10.1029/2000JD900252, 2000.
Kiene, R. P. and Bates, T. S.: Biological removal of dimethyl sulphide from sea water, Nature, 345, 702–705, 1990.
Klimont, Z., Smith, S. J., and Cofala, J.: The last decade of global anthropogenic sulfur dioxide: 2000-2011 emissions, Environ. Res. Lett., 8, 014003, https://doi.org/10.1088/1748-9326/8/1/014003, 2013.
Kloster, S., Six K. D., Feichter J., Maier-Reimer E., Roeckner E., Wetzel P., Stier P., and Esch M.: Response of dimethylsulfide (DMS) in the ocean and atmosphere to global warming, J. Geophys. Res., 112, G03005, https://doi.org/10.1029/2006JG000224, 2007.
Kloster, S., Feichter, J., Maier-Reimer, E., Six, K. D., Stier, P., and Wetzel, P.: DMS cycle in the marine ocean-atmosphere system – a global model study, Biogeosciences, 3, 29–51, https://doi.org/10.5194/bg-3-29-2006, 2006.
Leck, C., Larsson, U., Bågander, L. E., Johansson, S., and Hajdu, S.: Dimethyl sulfide in the Baltic Sea: Annual variability in relation to biological activity, J. Geophys. Res.-Ocean., 95, 3353–3363, https://doi.org/10.1029/JC095IC03P03353, 1990.
Legrand, M. and Pasteur, E. C.: Methane sulfonic acid to non-sea-salt sulfate ratio in coastal Antarctic aerosol and surface snow, J. Geophys. Res.-Atmos., 103, 10991–11006, https://doi.org/10.1029/98JD00929, 1998.
Legrand, M., Sciare J., Jourdain B., and Genthon, C.: Daily variations of dimethyl sulfide, dimethyl sulfoxide, methanesulfonate, and non-sea-salt sulfate aerosols at Dumont d’Urville (December 1998–March 1999), J. Geophys. Res., 106, 14409–14422, 2001.
Liss, P. S., Malin, G., Turner, S. M., and Holligan, P. M.: Dimethyl sulphide and Phaeocystis: A review, J. Mar. Syst., 5, 41–53, https://doi.org/10.1016/0924-7963(94)90015-9, 1994.
Lomans, B. P., Van der Drift, C., Pol, A., and Op den Camp, H. J. M.: Microbial cycling of volatile organic sulfur compounds, Cell. Mol. Life Sci., 59, 575–588, https://doi.org/10.1007/s00018-002-8450-6, 2002.
Marandino, C. A., De Bruyn, W. J., Miller, S. D., and Saltzman, E. S.: Eddy correlation measurements of the air/sea flux of dimethylsulfide over the North Pacific Ocean, J. Geophys. Res., 112, D03301. https://doi.org/10.1029/2006JD007293, 2007.
Minikin, A., Legrand, M., Hall, J., Wagenbach, D., Kleefeld, C., Wolff, E., Pasteur, E. C., and Ducroz, F.: Sulfur-containing species (sulfate and methanesulfonate) in coastal Antarctic aerosol and precipitation, J. Geophys. Res.-Atmos., 103, 10975–10990, https://doi.org/10.1029/98JD00249, 1998.
Montes-Hugo, M., Doney, S. C., Ducklow, H. W., Fraser, W., Martinson, D., Stammerjohn, S. E., and Schofield, O.: Recent changes in phytoplankton communities associated with rapid regional climate change along the western Antarctic Peninsula, Science, 323, 1470–1473, https://doi.org/10.1126/science.1164533, 2009.
Mulvaney, R. and Wolff, E. W.: Spatial variability of the major chemistry of the Antarctic ice sheet, Ann. Glaciol., 20, 440–447, https://doi.org/10.3189/1994AOG20-1-440-447, 1994.
Nightingale, P. D., Liss, P. S., and Schlosser, P.: Measurements of air-sea gas transfer during an open ocean algal bloom, Geophys. Res. Lett., 27, 2117–2120, https://doi.org/10.1029/2000GL011541, 2000.
Oliver, H., St-Laurent, P., Sherrell, R. M., and Yager, P. L.: Modeling Iron and Light Controls on the Summer Phaeocystis antarctica Bloom in the Amundsen Sea Polynya, Global Biogeochem. Cy., 33, 570–596, https://doi.org/10.1029/2018GB006168, 2020.
Park, K.-T., Lee, K., Shin, K., Jin Jeong, H., and Young Kim, K.: Improved Method for Minimizing Sulfur Loss in Analysis of Particulate Organic Sulfur, Anal. Chem., 86, 1352–1356, https://doi.org/10.1021/ac403649m, 2014.
Preunkert, S., Legrand, M., Jourdin, B., Moulin, C., Belviso, S., Kasamatsu, N., Fukuchi, M., and Hirawake, T.: Interannual variability of dimethylsulfide in air and seawater and its atmospheric oxidation by-products (methanesulfonate and sulfate) at Dumont d'Urville, coastal Antarctica (1999-2003), J. Geophys. Res.-Atmos., 112, 1–13, https://doi.org/10.1029/2006JD007585, 2007.
Preunkert, S., Jourdain, B., Legrand, M., Udisti, R., Becagli, S., and Cerri, O.: Seasonality of sulfur species (dimethyl sulfide, sulfate, and methanesulfonate) in Antarctica: Inland versus coastal regions, J. Geophys. Res.-Atmos., 113, D15302, https://doi.org/10.1029/2008JD009937, 2008.
Qu, B., Gabric, A. J., and Jackson, R.: Contemporary variability in dimethylsulfide flux in the Barents Sea and simulated change under 4×CO2 climate conditions, J. Mar. Syst., 220, 103573, https://doi.org/10.1016/j.jmarsys.2021.103573, 2021.
Quinn, P. K. and Bates, T. S.: The case against climate regulation via oceanic phytoplankton sulphur emissions, Nature, 480, 51–56, https://doi.org/10.1038/nature10580, 2011.
Read, K. A., Lewis, A. C., Bauguitte, S., Rankin, A. M., Salmon, R. A., Wolff, E. W., Saiz-Lopez, A., Bloss, W. J., Heard, D. E., Lee, J. D., and Plane, J. M. C.: DMS and MSA measurements in the Antarctic Boundary Layer: impact of BrO on MSA production, Atmos. Chem. Phys., 8, 2985–2997, https://doi.org/10.5194/acp-8-2985-2008, 2008.
Saba, G. K., Fraser, W. R., Saba, V. S., Iannuzzi, R. A., Coleman, K. E., Doney, S. C., Ducklow, H. W., Martinson, D. G., Miles, T. N., Patterson-Fraser, D. L., Stammerjohn, S. E., Steinberg, D. K., and Schofield, O. M.: Winter and spring controls on the summer food web of the coastal West Antarctic Peninsula, Nat. Commun., 51, 1–8, https://doi.org/10.1038/ncomms5318, 2014.
Savoca, M. S. and Nevitt, G. A.: Evidence that dimethyl sulfide facilitates a tritrophic mutualism between marine primary producers and top predators, P. Natl. Acad. Sci. USA, 111, 4157–4161, https://doi.org/10.1073/PNAS.1317120111, 2014.
Sciare, J., Mihalopoulos, N., and Dentener, F. J.: Interannual variability of atmospheric dimethylsulfide in the southern Indian Ocean, J. Geophys. Res.-Atmos., 105, 26369–26377, https://doi.org/10.1029/2000JD900236, 2000.
Sherrell, R. M., Lagerström, M. E., Forsch, K. O., Stammerjohn, S. E., and Yager, P. L.: Dynamics of dissolved iron and other bioactive trace metals (Mn, Ni, Cu, Zn) in the Amundsen Sea Polynya, Antarctica, Elementa, 3, 71, https://doi.org/10.12952/JOURNAL.ELEMENTA.000071, 2015.
Simó, R.: Production of atmospheric sulfur by oceanic plankton: Biogeochemical, ecological and evolutionary links, Trends Ecol. Evol., 16, 287–294, https://doi.org/10.1016/S0169-5347(01)02152-8, 2001.
Simó, R.: From cells to globe: approaching the dynamics of DMS (P) in the ocean at multiple scales, Can. J. Fish. Aquat. Sci., 61.5, 673–684, https://doi.org/10.1139/f04-030, 2004.
Simó, R. and Pedrós-Alió, C.: Short-term variability in the open ocean cycle of dimethylsulfide, Global Biogeochem. Cy., 13, 1173–1181, https://doi.org/10.1029/1999GB900081, 1999.
Simó, R., Pedrós-Alió, C. and Simó, R., and Pedrós-Alió, C.: Role of vertical mixing in controlling the oceanic production of dimethyl sulphide, Nature, 402, 396–398, https://doi.org/10.1038/46516, 1999.
St-Laurent, P., Yager, P. L., Sherrell, R. M., Stammerjohn, S. E., and Dinniman, M. S.: Pathways and supply of dissolved iron in the Amundsen Sea (Antarctica), J. Geophys. Res.-Ocean., 122, 7135–7162, https://doi.org/10.1002/2017JC013162, 2017.
Stefels, J.: Physiological aspects of the production and conversion of DMSP in marine algae and higher plants, J. Sea Res., 43, 183–187, https://doi.org/10.1016/S1385-1101(00)00030-7, 2000.
Stefels, J., Van Leeuwe, M. A., Jones, E. M., Meredith, M. P., Venables, H. J., Webb, A. L., and Henley, S. F.: Impact of sea-ice melt on dimethyl sulfide (sulfoniopropionate) inventories in surface waters of Marguerite Bay, West Antarctic Peninsula, Philos. Trans. R. Soc. A, 376, 2122, https://doi.org/10.1098/rsta.2017.0169, 2018.
Stein, A. F., Draxler, R. R., Rolph, G. D., Stunder, B. J. B., Cohen, M. D., and Ngan, F.: NOAA's HYSPLIT Atmospheric Transport and Dispersion Modeling System, Bull. Am. Meteorol. Soc., 96, 2059–2077, https://doi.org/10.1175/BAMS-D-14-00110.1, 2015.
Sunda, W. G., Hardison, R., Kiene, R. P., Bucciarelli, E., and Harada, H.: The effect of nitrogen limitation on cellular DMSP and DMS release in marine phytoplankton: Climate feedback implications, Aquatic Sciences, 69, 341–351, 2007.
Tortell, P. D., Long, M. C., Payne, C. D., Alderkamp, A. C., Dutrieux, P., and Arrigo, K. R.: Spatial distribution of pCO2, ΔO2/Ar and dimethylsulfide (DMS) in polynya waters and the sea ice zone of the Amundsen Sea, Antarctica, Deep. Res. Part II, 71–76, 77–93, https://doi.org/10.1016/j.dsr2.2012.03.010, 2012.
Trisolino, P., Di Sarra, A., Meloni, D., Pace, G., Anello, F., Becagli, S., Monteleone, F., and Sferlazzo, D.: Determination of Photosynthetically Active Radiation from multi-filter rotating shadowband measurements: Method and validation based on observations at Lampedusa (35.5∘ N, 12.6∘ E), in: AIP Conference Proceedings, vol. 1810, Radiation processes in the atmosphere and ocean (IRS2016), Auckland, New Zealand, 16–22 April 2016, 0800021–800024, https://doi.org/10.1063/1.4975533, 2017.
del Valle, D. A., Kieber, D. J., Toole, D. A., Bisgrove, J., and Kiene, R. P.: Dissolved DMSO production via biological and photochemical oxidation of dissolved DMS in the Ross Sea, Antarctica, Deep. Res. Part I, 2, 166–177, https://doi.org/10.1016/J.DSR.2008.09.005, 2009.
Vallina, S. M. and Simó, R.: Strong relationship between DMS and the solar radiation dose over the global surface ocean, Science, 315, 506–508, https://doi.org/10.1126/SCIENCE.1133680, 2007.
Vlahos, P. and Monahan, E. C.: A generalized model for the air-sea transfer of dimethyl sulfide at high wind speeds, Geophys. Res. Lett., 36, 1–6, https://doi.org/10.1029/2009GL040695, 2009.
Watanabe, S., Yamamoto H., and Tsunogai, S.: Relation between the concentrationsof DMS in surface sea water and air in the temperate North Pacific region, J. Atmos. Chem., 22, 271–283, https://doi.org/10.1007/BF00696638, 1995.
Wingenter, O. W., Haase, K. B., Zeigler, M., Blake, D. R., Rowland, F. S., Sive, B. C., Paulino, A., Thyrhaug, R., Larsen, A., Schulz, K., Meyerhöfer, M., and Riebesell, U.: Unexpected consequences of increasing CO2 and ocean acidity on marine production of DMS and CH2ClI: Potential climate impacts, Geophys. Res. Lett., 34, 223–224, https://doi.org/10.1029/2006GL028139, 2007.
Yager, E. M., Turowski, J. M., Rickenman, D., and McArdell, B. W.: Sediment supply, grain protrusion, and bedload transport in mountain streams, Geophys. Res. Lett., 39, 10402, https://doi.org/10.1029/2012GL051654, 2012.
Yan, J., Zhang, M., Jung, J., Lin, Q., Zhao, S., Xu, S., and Chen, L.: Influence on the conversion of DMS to MSA and SO4 2À in the Southern Ocean, Antarctica, Atmos. Environ., 233, 117611, https://doi.org/10.1016/j.atmosenv.2020.117611, 2020.
Zavarsky, A., Goddijn-Murphy, L.,Steinhoff, T., and Marandino, C. A.: Bubble-mediated gas transfer and gas transfer suppression of DMS and CO2, J. Geophys. Res., 123, 6624–6647, https://doi.org/10.1029/2017JD028071, 2018.
Zhang, M., Chen, L., Xu, G., Lin, Q., and Liang, M.: Linking phytoplankton activity in polynyas and sulfur aerosols over Zhongshan Station, East Antarctica, J. Atmos. Sci., 72, 4629–4642, https://doi.org/10.1175/JAS-D-15-0094.1, 2015.
Zindler, C., Marandino, C. A., Bange, H. W., Schütte, F., and Saltzman, E. S.: Nutrient availability determines dimethyl sulfide and isoprene distribution in the eastern Atlantic Ocean, Geophys. Res. Lett., 41, 3181–3188, https://doi.org/10.1002/2014GL059547, 2014.